
- Title
-
The TET-Sall4-BMP regulatory axis controls craniofacial cartilage development
- Authors
- Wang, W., Yang, N., Wang, L., Zhu, Y., Chu, X., Xu, W., Li, Y., Xu, Y., Gao, L., Zhang, B., Zhang, G., Sun, Q., Wang, W., Wang, Q., Zhang, W., Chen, D.
- Source
- Full text @ Cell Rep.
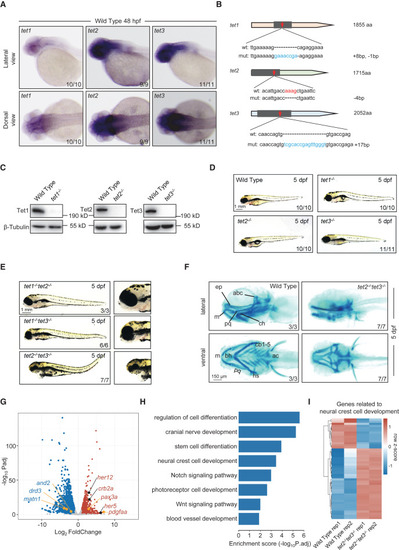
Loss of Tet2 and Tet3 cause defects in craniofacial cartilage development (A) In situ hybridization assay showing tet1, tet2, and tet3 transcripts in wild-type embryos at 48 hpf. Upper, lateral views, anterior toward the left. Lower, dorsal views, anterior toward the left. (B) Generation of tet1, tet2, and tet3 mutant zebrafish. The red arrow indicates the target region of CRISPR-Cas9 gene editing. The nucleotide sequences of wild-type and frameshift mutations are shown. (C) Western blot showing the abundance of Tet proteins in adult brains from wild-type and mutant zebrafish. The molecular weight is shown. β-Tubulin is used as a loading control. (D) Gross morphology of the whole bodies of wild-type and tet1, tet2, or tet3 single mutant at 5 dpf. Lateral views, anterior toward the left. Scale bars, as indicated. (E) Gross morphology of tet1/2, tet1/3, or tet2/3 double mutants at 5 dpf. Lateral views, anterior toward the left. Scale bars, as indicated. (F) Alcian blue staining showing the morphology of pharyngeal cartilage in wild-type and tet2/3 double mutants at 5 dpf. Upper, lateral views, anterior toward the left. Lower, ventral views, anterior toward the left. bh, basihyal; cb, ceratobranchial; ep, ethmoid plate; ac, auditory capsule; abc, anterior basicranial commissure; ch, ceratohyal; hs, hyosymplectic; m, Meckel’s cartilage; pq, palatoquadrate. Scale bars, as indicated. (G) Volcano plots showing gene expression in wild-type and tet2/3 double-knockout (DKO) embryos at 48 hpf. Some DEGs with important physiological functions are highlighted. The cutoff of log2 fold change threshold is ±1. (H) Bar plot showing the Gene Ontology (GO) enrichment items of DEGs. (I) Heatmap showing the expression of selected functional genes in wild-type and tet2/3-DKO embryos at 48 hpf. Each biological replicate for different samples is shown. Expression is shown in blue and red; intensity is proportional to the normalized expression levels. See also Figure S1. |
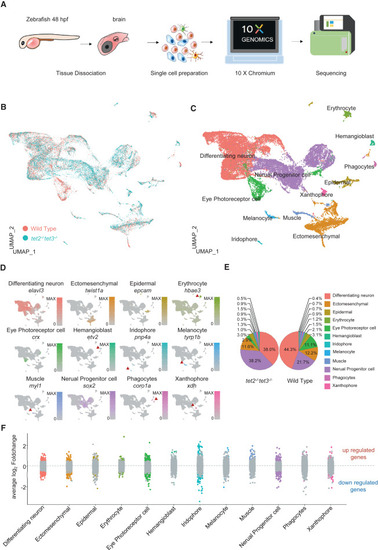
Single-cell transcriptomic atlases of heads from wild-type and tet2/3-DKO embryos at 48 hpf (A) Schematic of the experimental protocol for scRNA-seq analysis. Tissues were dissected from zebrafish embryos at 48 hpf and then enzymatically dissociated into single-cell suspensions. The scRNA-seq libraries were constructed and subjected to high-throughput sequencing. (B) Uniform manifold approximation and projection (UMAP) projection showing cell clustering in wild-type (orange) and tet2/3-DKO (turquoise) samples. (C) UMAP projection showing the annotation of cell clusters with different colors. (D) Feature plots showing the expression of canonical cell markers for each cell type. (E) Pie chart showing the proportions and color codes for each cell type in heads from wild-type and tet2/3-DKO embryos at 48 hpf. (F) Scatterplot showing the DEGs for each cell type. Each dot corresponds to a gene. Gray, not significant. Color coded according to cell type, significant (p<0.00001) DEGs. See also Figures S2 and S3. |
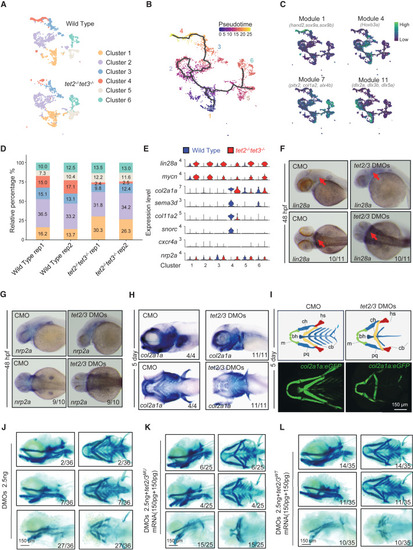
Loss of tet2/3 disrupts pharyngeal cartilage development by impairing chondrocyte differentiation (A) Re-clustering analysis showing six sub-clusters of EMCs indicated by different colors. Top, wild-type EMCs. Bottom, tet2/3-DKO EMCs. (B) Pseudotime-ordered analysis of EMCs. The black lines highlight the branching of the two differentiation trajectories in pseudotime. (C) Four modules of transcription factors identified with distinct expression features. Feature plots showing expression scores for each module. (D) Split bars showing the cellular composition of each replicate for different samples. (E) Violin plots showing the expression level of indicated genes in each EMC sub-cluster of wild-type (blue) and tet2/3-DKO (red) samples. (F–H) In situ hybridization assays showing the transcripts of lin28a, nrp2a, and col2a1a in embryos injected with indicated morpholinos at 48 hpf. Upper, lateral views, anterior toward the left. Lower, dorsal (F and G), or ventral (H) views, anterior toward the left. (I) Tg(col2a1a: EGFP) transgene embryos injected with control morpholino (left) and tet2/3 DMOs (right). Top, schematic of pharyngeal cartilage in embryos with different phenotypes. Bottom, the cartilage is shown by col2a1a signals labeled with green fluorescence. Scale bars, as indicated. (J–L) Alcian blue staining showing the morphology of craniofacial cartilage in embryos injected with indicated morpholinos and mRNAs at 5 dpf. Embryos were injected with tet2/3 DMOs (J), with tet2/3 DMOs and tet2/3 mutant mRNAs (K), and with tet2/3 DMOs and wild-type tet2/3 mRNAs (L). Scale bars, as indicated. See also Figure S4. |
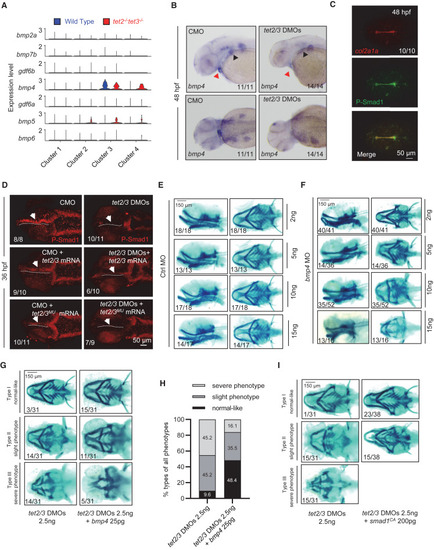
TET2/3 regulate pharyngeal cartilage development by controlling BMP signaling (A) Violin plots showing the expression of typical BMP ligands in EMC sub-clusters between wild-type (blue) and tet2/3-DKO (red) samples. (B) In situ hybridization assay showing bmp4 transcripts in embryos injected with CMO and tet2/3 DMOs at 48 hpf. Upper, lateral views, anterior toward the left. Lower, dorsal views, anterior toward the left. (C) Overlapping of col2a1a mRNA (red) and p-Smad1 (green) signals in zebrafish embryos at 48 hpf. Scale bars, as indicated. (D) Overexpression of wild-type tet2/3, but not mutant form, can restore the level of pSmad1 in tet2/3 morphants at36 hpf. Arrows indicate pSmad1 signals. Scale bars, as indicated. (E and F) Knockdown of bmp4 (F) induces defective cartilage phenotypes in a dose-dependent manner, compared to controls (E). Left panel, lateral views, anterior toward the left. Right panel, ventral views, anterior toward the left. Scale bars, as indicated. (G) Alcian blue staining showing overexpression of bmp4 suppressed the defective phenotype in tet2/3 morphants. Left panel, lateral views, anterior toward the left. Right panel, ventral views, anterior toward the left. Scale bar, as indicated. (H) The extent of defective cartilage phenotypes is divided into three groups. The ratio of each group is shown. (I) Alcian blue staining showing overexpression of smad1CA can suppress the defective phenotype in tet2/3 morphants. Left panel, lateral views, anterior toward the left. Right panel, ventral views, anterior toward the left. Scale bars, as indicated. See also Figures S5 and S6. |
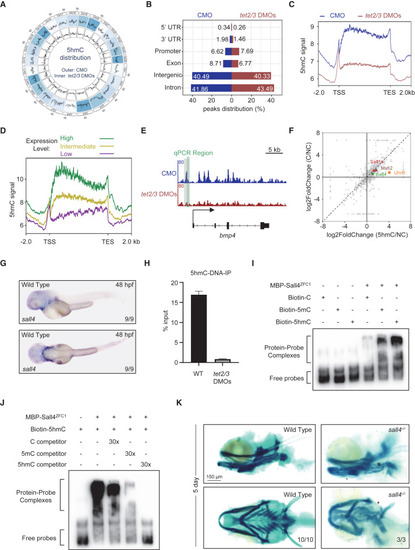
Sall4 recognizes 5hmC and controls the Bmp4 expression to regulate pharyngeal cartilage development (A) Circos plot showing 5hmC distribution pattern across whole genome in embryos injected with indicated morpholinos at 48 hpf. Outer circle, CMO samples. Inner circle, tet2/3 DMOs samples. (B) Histogram showing the 5hmC distribution in different genomic regions in embryos injected with CMO (blue) and tet2/3 DMOs (red) at 48 hpf. (C) The density of 5hmC signals in genes. The 2-kb upstream and downstream flanks are aligned. 5hmC enrichments within each 10-bp interval are plotted. TSS, transcription start site; TTS, transcription termination site. (D) 5hmC over genes with different expression levels. High expression (green): fragments per kilobase of exon per million mapped fragments (FPKM) ≥10. Intermediate expression (yellow): 1 ≤ FPKM < 10. Low expression (purple): FPKM < 1. (E) Integrative genomics viewer (IGV) visualization of 5hmC peaks surrounding bmp4 in embryos CMO (blue) and DMO (red). The green box indicates the position selected for qPCR analysis. (F) Scatterplot showing proteins enriched by C or 5hmC-contained probes. (G) In situ hybridization assay showing sall4 transcripts in wild-type embryos at 48 hpf. Upper, lateral views, anterior toward the left. Lower, dorsal views, anterior toward the left. (H) qPCR analysis showing a significant reduction of 5hmC modification on the bmp4 promoter. Error bars represent +SD for three replicates. (I) EMSA showing the signals of the shifted probe bands in the presence of Sall4ZFC1 protein. (J) Competitive EMSA in different titrations showing the different affinities of Sall4ZFC1 protein to C/5mC/5hmC double-stranded DNA probes. (K) Alcian blue staining showing defective cartilage phenotypes in sall4 mutant embryos at 5 dpf. Upper, lateral views, anterior toward the left. Lower, ventral views, anterior toward the left. Scale bars, as indicated. See also Figure S7. |
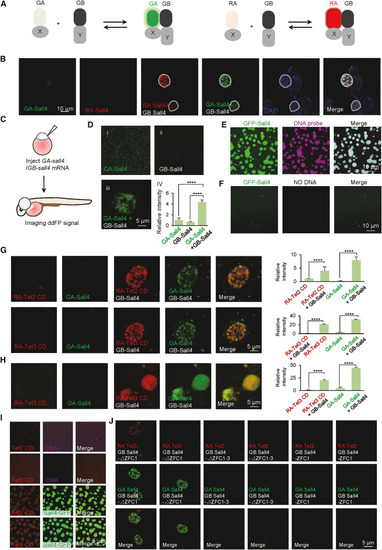
Sall4 co-phase separates with Tet2/3 proteins (A) Schematic representation of ddFP assay system. (B) Live-cell images showing Sall4 forms self-assembly granules in U-2 OS cells expressing GA-Sall4 (green) and GB-sall4 or RA-Sall4 (red) and GB-sall4. Scale bars, as indicated. (C) Schematic representation of ddFP assay system to perform the live-cell imaging assay in zebrafish embryos. (D) (i–iii) Live-cell images showing Sall4 forms self-assembly granules (green) in the nucleus of embryonic cells at 48 hpf. Indicated mRNAs were injected in one-cell stage embryos. Scale bars, as indicated. (iv) The relative fluorescence intensity of GA-Sall4 or GB-Sall4 only or when they co-expressed in zebrafish embryos. Statistical variance is examined by the two-tailed Student’s t test. Error bars indicate mean ± SD (n = 6). ∗∗∗∗p < 0.0001. (E) Sall4 (green) can co-phase separated into droplets with DNA probes (red). Scale bars, as indicated. (F) Sall4 (green) alone forms smaller-sized droplets. Scale bars, as indicated. (G) Live-cell images (left) showing ddFP signals of Tet2-Sall4 (red) or Tet3-Sall4 (red) and Sall4-Sall4 signal (green) in U-2 OS cell expressing indicated proteins. Scale bars, as indicated. Histograms (right) showing the relative fluorescence intensity correspond to left images. Statistical variance is examined by the two-tailed Student’s t test. Error bars indicate mean ± SD (n = 10). ∗∗∗∗p < 0.0001. (H) Live-cell images showing ddFP signals of Tet3 CD and Sall4 in the nucleus of embryonic cells at 48 hpf. Indicated mRNAs were injected in one-cell-stage embryos. Scale bars, as indicated. Histograms (right) showing the relative fluorescence intensity corresponding to left images. Statistical variance is examined by the two-tailed Student’s t test. Error bars indicate mean ± SD (n = 10). ∗∗∗∗p < 0.0001. (I) Tet2 CD (red) or Tet3 CD (red) can form droplets when mixed with Sall4 (green) and DNA probes. Scale bars, as indicated. (J) Live-cell images showing Tet2 (red) and Tet3 (red) fail to form condensed granules with Sall4 delta ZFC1-4 (green) and Sall4ZFC1 (green). Scale bars, as indicated. See also Figure S8. |
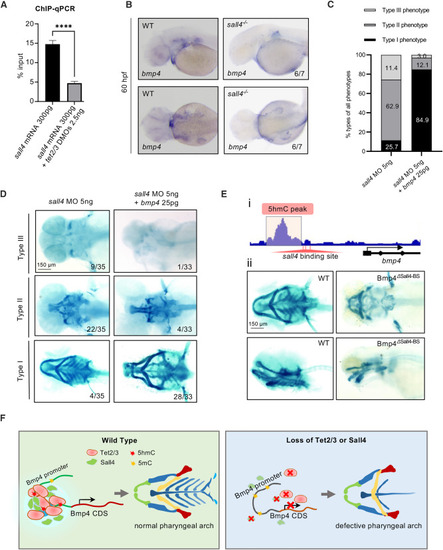
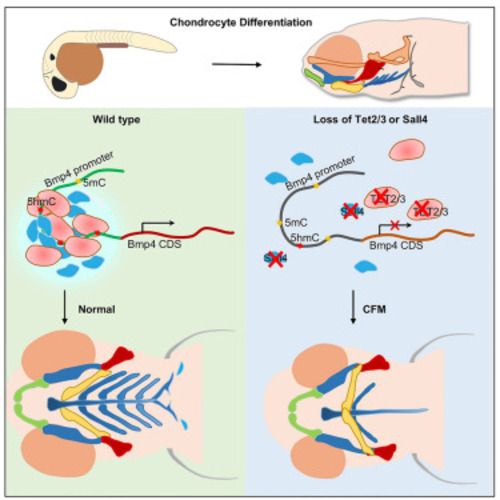
Sall4 regulates bmp4 expression to control pharyngeal arch development (A) Chromatin immunoprecipitation (ChIP)-qPCR analysis of Sall4 binding to the bmp4 promoter in wild-type and tet2/3 morphants at 48 hpf. Statistical variance is examined by the two-tailed Student’s t test. Error bars indicate mean ± SD (n = 3). ∗∗∗∗p < 0.0001. (B) In situ hybridization assay showing the loss of sall4 causes a reduction of bmp4 transcripts in the mandibular region. (C) The bar plot showing the extent of defect cartilage phenotypes is divided into three groups. The ratio of each group is shown. (D) Alcian blue staining assays showing overexpression of bmp4 can partially rescue the pharyngeal cartilage phenotype caused by loss of sall4 at 5 dpf. Scale bars, as indicated. (E) (i) Schematic showing a 5hmC peak and the deletion of Sall4-binding sites on the bmp4 promoter. (ii) Alcian blue staining showing deletion of Sall4-binding sites on the bmp4 promoter causes defective cartilage phenotypes in embryos at 5 dpf. Upper, ventral view. Lower, lateral view. WT, wild type. Scale bars, as indicated. (F) Model of Tet2/3 and Sall4 action on the bmp4 promoter. |
|