Fig. 5
- ID
- ZDB-FIG-240516-6
- Publication
- Wang et al., 2024 - The TET-Sall4-BMP regulatory axis controls craniofacial cartilage development
- Other Figures
- All Figure Page
- Back to All Figure Page
|
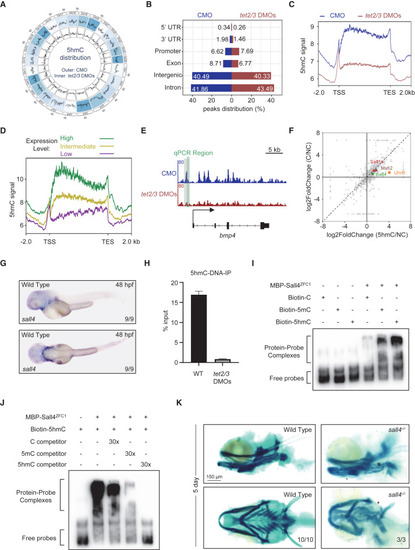
Sall4 recognizes 5hmC and controls the Bmp4 expression to regulate pharyngeal cartilage development (A) Circos plot showing 5hmC distribution pattern across whole genome in embryos injected with indicated morpholinos at 48 hpf. Outer circle, CMO samples. Inner circle, tet2/3 DMOs samples. (B) Histogram showing the 5hmC distribution in different genomic regions in embryos injected with CMO (blue) and tet2/3 DMOs (red) at 48 hpf. (C) The density of 5hmC signals in genes. The 2-kb upstream and downstream flanks are aligned. 5hmC enrichments within each 10-bp interval are plotted. TSS, transcription start site; TTS, transcription termination site. (D) 5hmC over genes with different expression levels. High expression (green): fragments per kilobase of exon per million mapped fragments (FPKM) ≥10. Intermediate expression (yellow): 1 ≤ FPKM < 10. Low expression (purple): FPKM < 1. (E) Integrative genomics viewer (IGV) visualization of 5hmC peaks surrounding bmp4 in embryos CMO (blue) and DMO (red). The green box indicates the position selected for qPCR analysis. (F) Scatterplot showing proteins enriched by C or 5hmC-contained probes. (G) In situ hybridization assay showing sall4 transcripts in wild-type embryos at 48 hpf. Upper, lateral views, anterior toward the left. Lower, dorsal views, anterior toward the left. (H) qPCR analysis showing a significant reduction of 5hmC modification on the bmp4 promoter. Error bars represent +SD for three replicates. (I) EMSA showing the signals of the shifted probe bands in the presence of Sall4ZFC1 protein. (J) Competitive EMSA in different titrations showing the different affinities of Sall4ZFC1 protein to C/5mC/5hmC double-stranded DNA probes. (K) Alcian blue staining showing defective cartilage phenotypes in sall4 mutant embryos at 5 dpf. Upper, lateral views, anterior toward the left. Lower, ventral views, anterior toward the left. Scale bars, as indicated. See also Figure S7. |

