
Fig. 2
- ID
- ZDB-FIG-240516-3
- Publication
- Wang et al., 2024 - The TET-Sall4-BMP regulatory axis controls craniofacial cartilage development
- Other Figures
- All Figure Page
- Back to All Figure Page
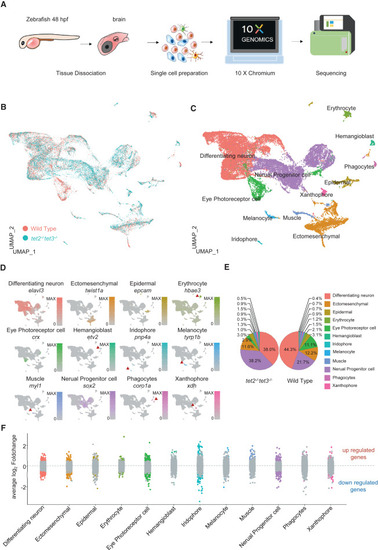
Single-cell transcriptomic atlases of heads from wild-type and tet2/3-DKO embryos at 48 hpf (A) Schematic of the experimental protocol for scRNA-seq analysis. Tissues were dissected from zebrafish embryos at 48 hpf and then enzymatically dissociated into single-cell suspensions. The scRNA-seq libraries were constructed and subjected to high-throughput sequencing. (B) Uniform manifold approximation and projection (UMAP) projection showing cell clustering in wild-type (orange) and tet2/3-DKO (turquoise) samples. (C) UMAP projection showing the annotation of cell clusters with different colors. (D) Feature plots showing the expression of canonical cell markers for each cell type. (E) Pie chart showing the proportions and color codes for each cell type in heads from wild-type and tet2/3-DKO embryos at 48 hpf. (F) Scatterplot showing the DEGs for each cell type. Each dot corresponds to a gene. Gray, not significant. Color coded according to cell type, significant (p<0.00001) DEGs. See also Figures S2 and S3. |