
|
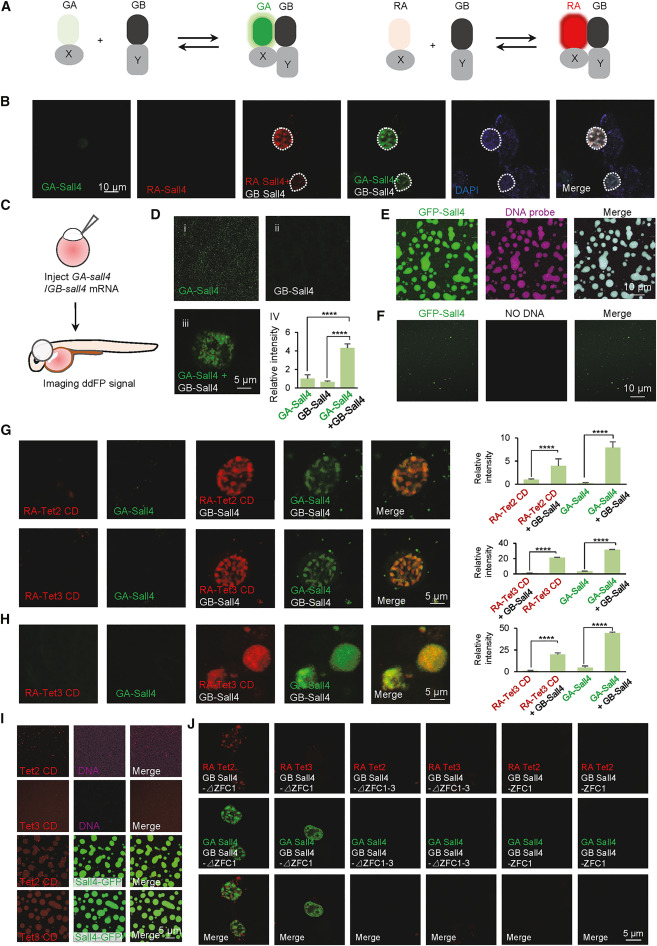
Fig. 6 Sall4 co-phase separates with Tet2/3 proteins (A) Schematic representation of ddFP assay system. (B) Live-cell images showing Sall4 forms self-assembly granules in U-2 OS cells expressing GA-Sall4 (green) and GB-sall4 or RA-Sall4 (red) and GB-sall4. Scale bars, as indicated. (C) Schematic representation of ddFP assay system to perform the live-cell imaging assay in zebrafish embryos. (D) (i–iii) Live-cell images showing Sall4 forms self-assembly granules (green) in the nucleus of embryonic cells at 48 hpf. Indicated mRNAs were injected in one-cell stage embryos. Scale bars, as indicated. (iv) The relative fluorescence intensity of GA-Sall4 or GB-Sall4 only or when they co-expressed in zebrafish embryos. Statistical variance is examined by the two-tailed Student’s t test. Error bars indicate mean ± SD (n = 6). ∗∗∗∗p < 0.0001. (E) Sall4 (green) can co-phase separated into droplets with DNA probes (red). Scale bars, as indicated. (F) Sall4 (green) alone forms smaller-sized droplets. Scale bars, as indicated. (G) Live-cell images (left) showing ddFP signals of Tet2-Sall4 (red) or Tet3-Sall4 (red) and Sall4-Sall4 signal (green) in U-2 OS cell expressing indicated proteins. Scale bars, as indicated. Histograms (right) showing the relative fluorescence intensity correspond to left images. Statistical variance is examined by the two-tailed Student’s t test. Error bars indicate mean ± SD (n = 10). ∗∗∗∗p < 0.0001. (H) Live-cell images showing ddFP signals of Tet3 CD and Sall4 in the nucleus of embryonic cells at 48 hpf. Indicated mRNAs were injected in one-cell-stage embryos. Scale bars, as indicated. Histograms (right) showing the relative fluorescence intensity corresponding to left images. Statistical variance is examined by the two-tailed Student’s t test. Error bars indicate mean ± SD (n = 10). ∗∗∗∗p < 0.0001. (I) Tet2 CD (red) or Tet3 CD (red) can form droplets when mixed with Sall4 (green) and DNA probes. Scale bars, as indicated. (J) Live-cell images showing Tet2 (red) and Tet3 (red) fail to form condensed granules with Sall4 delta ZFC1-4 (green) and Sall4ZFC1 (green). Scale bars, as indicated. See also Figure S8.