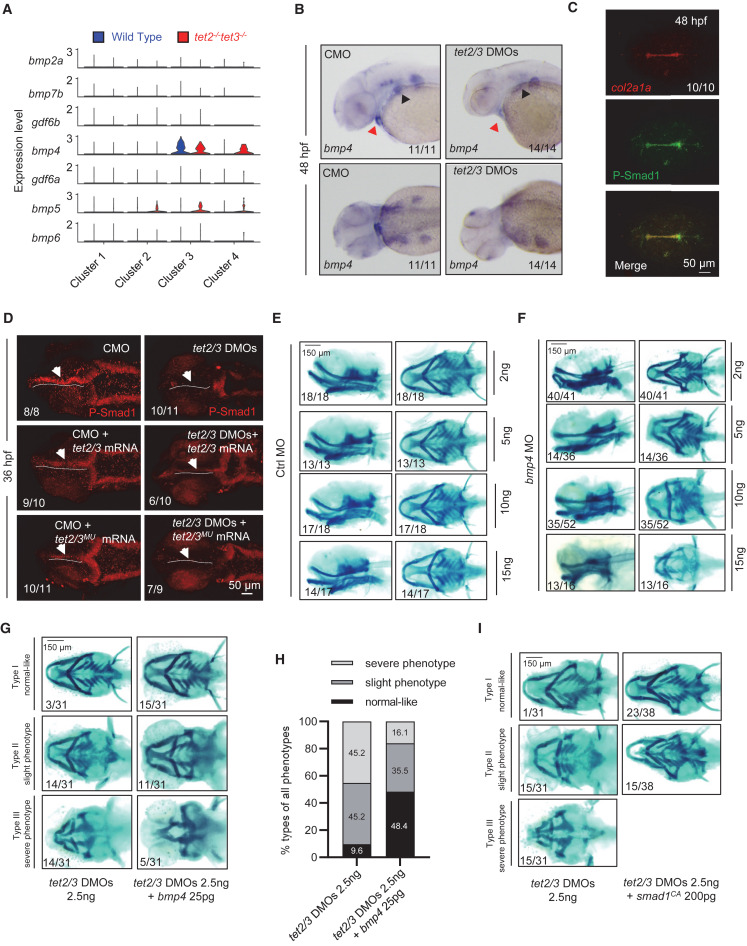
Fig. 4 TET2/3 regulate pharyngeal cartilage development by controlling BMP signaling (A) Violin plots showing the expression of typical BMP ligands in EMC sub-clusters between wild-type (blue) and tet2/3-DKO (red) samples. (B) In situ hybridization assay showing bmp4 transcripts in embryos injected with CMO and tet2/3 DMOs at 48 hpf. Upper, lateral views, anterior toward the left. Lower, dorsal views, anterior toward the left. (C) Overlapping of col2a1a mRNA (red) and p-Smad1 (green) signals in zebrafish embryos at 48 hpf. Scale bars, as indicated. (D) Overexpression of wild-type tet2/3, but not mutant form, can restore the level of pSmad1 in tet2/3 morphants at36 hpf. Arrows indicate pSmad1 signals. Scale bars, as indicated. (E and F) Knockdown of bmp4 (F) induces defective cartilage phenotypes in a dose-dependent manner, compared to controls (E). Left panel, lateral views, anterior toward the left. Right panel, ventral views, anterior toward the left. Scale bars, as indicated. (G) Alcian blue staining showing overexpression of bmp4 suppressed the defective phenotype in tet2/3 morphants. Left panel, lateral views, anterior toward the left. Right panel, ventral views, anterior toward the left. Scale bar, as indicated. (H) The extent of defective cartilage phenotypes is divided into three groups. The ratio of each group is shown. (I) Alcian blue staining showing overexpression of smad1CA can suppress the defective phenotype in tet2/3 morphants. Left panel, lateral views, anterior toward the left. Right panel, ventral views, anterior toward the left. Scale bars, as indicated. See also Figures S5 and S6.
Image
Figure Caption
Acknowledgments
This image is the copyrighted work of the attributed author or publisher, and
ZFIN has permission only to display this image to its users.
Additional permissions should be obtained from the applicable author or publisher of the image.
Full text @ Cell Rep.

