
|
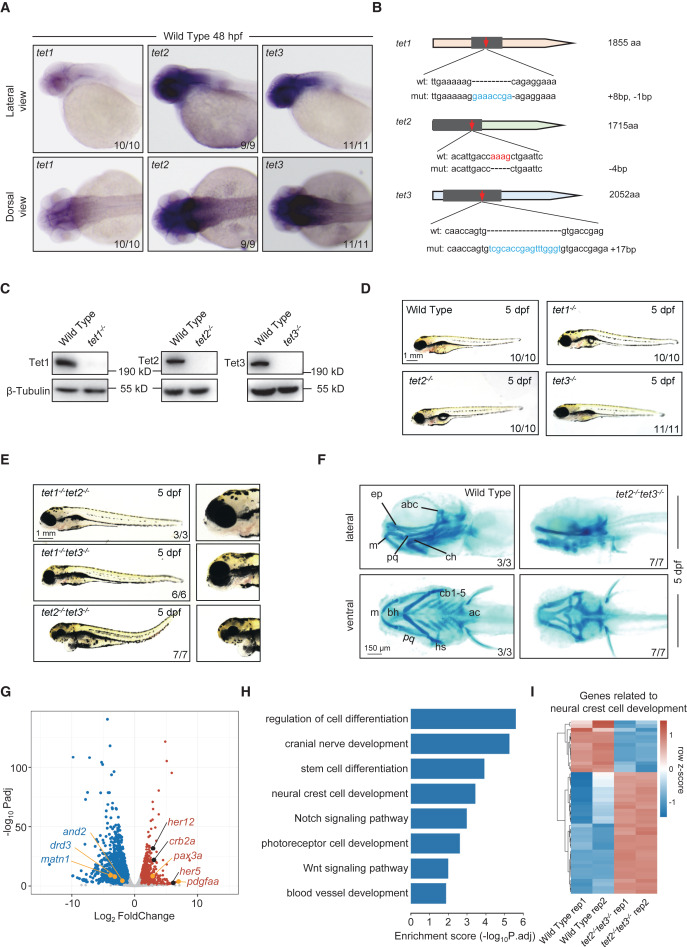
Fig. 1 Loss of Tet2 and Tet3 cause defects in craniofacial cartilage development (A) In situ hybridization assay showing tet1, tet2, and tet3 transcripts in wild-type embryos at 48 hpf. Upper, lateral views, anterior toward the left. Lower, dorsal views, anterior toward the left. (B) Generation of tet1, tet2, and tet3 mutant zebrafish. The red arrow indicates the target region of CRISPR-Cas9 gene editing. The nucleotide sequences of wild-type and frameshift mutations are shown. (C) Western blot showing the abundance of Tet proteins in adult brains from wild-type and mutant zebrafish. The molecular weight is shown. β-Tubulin is used as a loading control. (D) Gross morphology of the whole bodies of wild-type and tet1, tet2, or tet3 single mutant at 5 dpf. Lateral views, anterior toward the left. Scale bars, as indicated. (E) Gross morphology of tet1/2, tet1/3, or tet2/3 double mutants at 5 dpf. Lateral views, anterior toward the left. Scale bars, as indicated. (F) Alcian blue staining showing the morphology of pharyngeal cartilage in wild-type and tet2/3 double mutants at 5 dpf. Upper, lateral views, anterior toward the left. Lower, ventral views, anterior toward the left. bh, basihyal; cb, ceratobranchial; ep, ethmoid plate; ac, auditory capsule; abc, anterior basicranial commissure; ch, ceratohyal; hs, hyosymplectic; m, Meckel’s cartilage; pq, palatoquadrate. Scale bars, as indicated. (G) Volcano plots showing gene expression in wild-type and tet2/3 double-knockout (DKO) embryos at 48 hpf. Some DEGs with important physiological functions are highlighted. The cutoff of log2 fold change threshold is ±1. (H) Bar plot showing the Gene Ontology (GO) enrichment items of DEGs. (I) Heatmap showing the expression of selected functional genes in wild-type and tet2/3-DKO embryos at 48 hpf. Each biological replicate for different samples is shown. Expression is shown in blue and red; intensity is proportional to the normalized expression levels. See also Figure S1.