
- Title
-
Allelic heterogeneity of TTNtv cardiomyopathy can be modeled in adult zebrafish
- Authors
- Zhu, P., Li, J., Yan, F., Islam, S., Lin, X., Xu, X.
- Source
- Full text @ JCI Insight
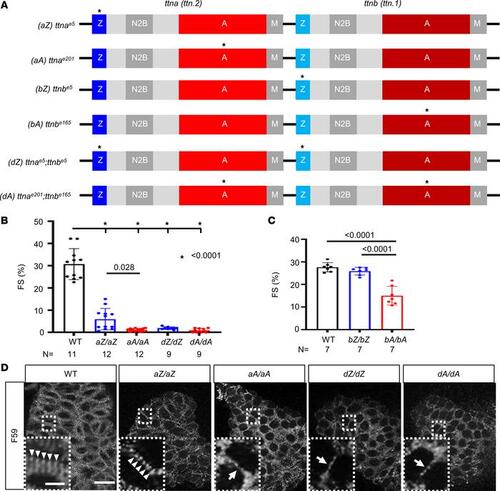
AH in cardiac function and sarcomere structure is noted in homozygous ttntv embryos. (A) Schematics of the ttntv mutants. These mutants have been generated previously (33). * indicates the location of truncation mutations. (B) Quantification of fractional shortening in the embryonic hearts at 2 dpf. *P < 0.0001. (C) Quantification of fractional shortening in the embryonic hearts at 9 dpf. (D) Comparison of cardiac sarcomere structure in 2 dpf embryos via F59 antibody staining. Scale bar = 20 μm. Insets show enlarged images of the area enclosed with dashed lines. Scale bar = 5 μm. Arrowheads indicate sarcomeres with striated patterns. Arrows indicate immature sarcomeres with less striated patterns. |
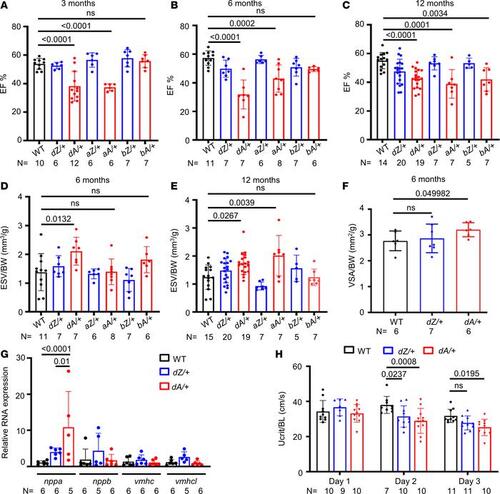
AH in cardiac contraction is noted in adult zebrafish heterozygous ttntv mutants. (A–C) Quantification of the ejection fraction in adult zebrafish at 3–12 months via high-frequency echocardiography. One-way ANOVA was applied. (D and E) Quantification of end-systolic volume/body weight (ESV/BW) in adult zebrafish at 6–12 months. One-way ANOVA was applied. (F) Comparison of dissected ventricular size in 6-month fish. Independent samples t test was applied to compare WT with dZ/+ and WT with dA/+. (G) Expression of nppa, nppb, vmhc, and vmhcl gene transcripts by quantitative real-time PCR in 6-month WT, dZ/+, and dA/+ fish. One-way ANOVA was applied. (H) The swimming challenge test indicated a reduced swimming ability in ttntv fish compared with WT fish at 15 months of age. Two-way ANOVA was applied to compare WT versus dZ/+, WT versus dA/+, and dZ/+ versus dA/+ in each day group. Data are presented as mean ± SD. VSA, ventricular surface area; BL, body length. |
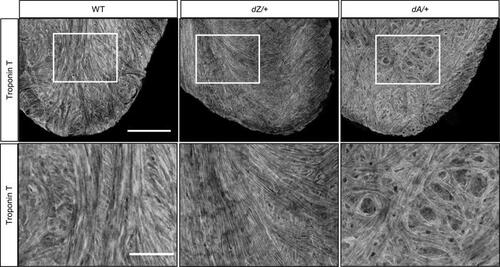
AH in myofibril organization is noted in adult zebrafish ttntv mutants. Shown is anti–Troponin T immunostaining of a whole heart isolated from a 15-month-old zebrafish using tissue clearance technology. Distorted myofibrils were noted in dA/+ but not in dZ/+ and WT. n = 3 in each group. Scale bar = 100 μm. Images in the bottom panel are enlarged images of the marked area in the upper panel. Scale bar = 50 μm. |
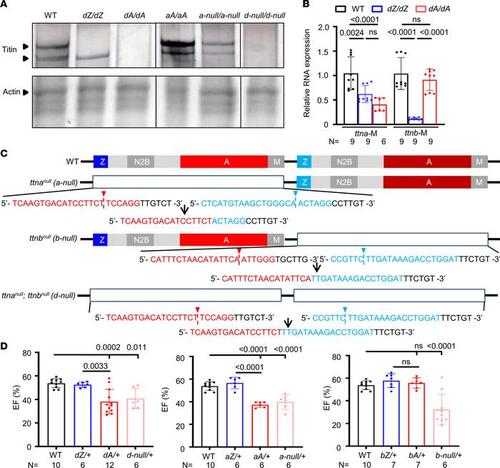
ttn-null mutants manifest similar phenotypes to ttntv-A but not ttntv-Z mutants. (A) Protein analysis of 2 dpf larvae of WT, dZ/dZ, dA/dA, aA/aA, a-null/a-null, and d-null/d-null mutants. The upper lane shows silver staining of a 2% SDS-agarose gel. The same protein lysates were then analyzed by Coomassie blue staining with a 12.5% SDS-PAGE system, as shown in the bottom lane. The expression of Actin was used as a loading control. (B) ttna and ttnb mRNA expression levels in dA/dA and dZ/dZ embryos, as revealed by quantitative PCR using primer pairs that recognize the M-line exons of ttna and ttnb, respectively. (C) Schematics of the location of sgRNAs that were used to generate the large deletions in ttn-a-null, ttn-b-null, and ttn-d-null. The red and blue sequences are sgRNAs on either side. Arrowheads indicate the cutting sites, and the resulting genome sequence is listed below. (D) High-frequency echocardiography was performed in adult zebrafish at 6 months to quantify the ejection fraction. One-way ANOVA was used to compare multiple groups for each mutation. Data are presented as mean ± SD. |
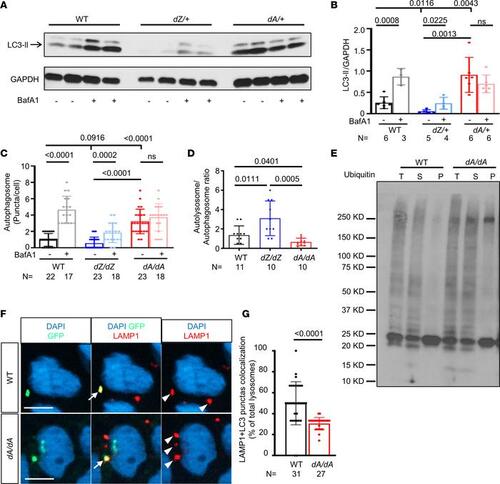
AH in autophagy dysregulation is noted in ttntv models, and autophagic flux is affected by ttntv-A. (A) Representative Western blot of LC3-II from 12-month-old zebrafish hearts. (B) Quantification of A; autophagy is differentially dysregulated in dA/+ vs. dZ/+ fish, with dA/+ showing increased basal LC3-II and impaired autophagic flux, while dZ/+ exhibits reduced basal LC3-II. (C) Quantification of autophagosome puncta in 2 dpf BafA1-treated embryos (Supplemental Figure 7A). (D) Quantification of the autolysosome/autophagosome ratio of 2 dpf non-BafA1-treated embryos (Supplemental Figure 7A). (E) Ubiquitin-conjugated (Ub-conjugated) proteins were moderately increased in detergent-insoluble fractions of dA/dA embryo lysates. The dA/dA fish and WT siblings at 5 dpf were subjected to cell fractionation, and the resulting total lysates (T), soluble fractions (S), and insoluble fractions (P) were analyzed by Western blot using an Ub antibody. The blot is representative of 3 independent experiments. (F) Representative image and quantification of LC3-GFP and lysosome marker LAMP1 colocalization compared with the total LAMP1-stained lysosome. The arrow indicates a yellow puncta with both GFP and LAMP1 that represents colocalization, and the arrowhead indicates a red puncta with only LAMP1. Scale bar: 5 μm. (G) Quantification of F. In this figure, independent samples t test is used. Data are presented as mean ± SD. |
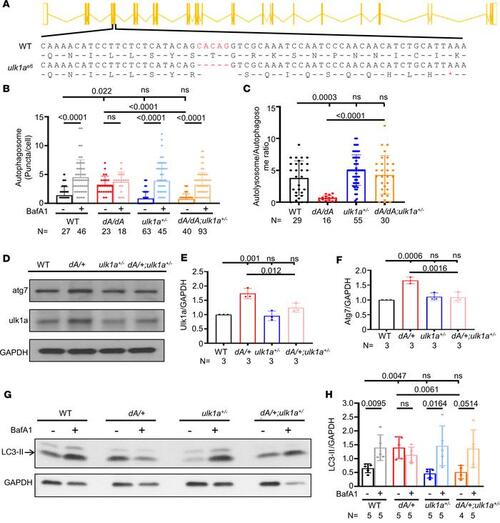
ulk1a mutants repair defective autophagic flux in both embryonic and adult stages of ttntv-A mutants. (A) Schematics of ulk1ae6 generated by MMEJ sgRNA. Red indicates deleted nucleotides. * indicates the nonsense codons. (B and C) Quantification of the autophagosome puncta in 2 dpf embryos either with or without BafA1 treatment and the autolysosome/autophagosome ratio of BafA1-untreated groups. ulk1a+/– can reduce the basal autophagosome level of dA/dA and can recover the autophagic flux affected by dA/dA. One-way ANOVA was applied. (D–F) Representative Western blot and quantification of ulk1a and atg7 from 3-month zebrafish hearts. One-way ANOVA was applied. (G and H) Representative Western blot and quantification of LC3-II from zebrafish hearts either with or without BafA1 treatment at 3 months. Independent samples t test was applied to compare 2 groups. Data are presented as mean ± SD. |
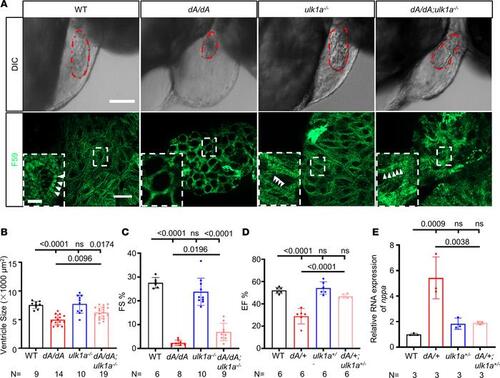
ulk1a mutants repair cardiac dysfunction in both adult and embryonic stages of ttntv-A mutants. (A) Immunostaining and differential interference contrast (DIC) images of 2 dpf embryos. Sarcomere structures were obtained by immunostaining with an anti-F59 (green) antibody in WT, dA/dA, ulk1a–/–, and dA/dA ulk1a–/–. Higher magnifications of the boxed areas are shown in the insets. White arrowheads indicate striated sarcomere structures. The embryonic ventricle is outlined by dashed red lines in the DIC images. The scale bar of the upper panel is 100 μm, the lower panel is 10 μm, and the inset is 2.5 μm. (B) Quantification of the ventricle area based on the area outlined by the dashed red lines in the DIC panels of Figure 7A. (C) Quantification of fractional shortening in embryonic hearts. (D) High-frequency echocardiography was performed on 6-month-old zebrafish to quantify EF%. (E) Evaluation of nppa gene transcript expression by quantitative real-time PCR in hearts from 3-month-old adult zebrafish. One-way ANOVA was used to compare multiple groups for each mutation. Data are presented as mean ± SD. |