
Fig. 5
- ID
- ZDB-FIG-240517-31
- Publication
- Zhu et al., 2024 - Allelic heterogeneity of TTNtv cardiomyopathy can be modeled in adult zebrafish
- Other Figures
- All Figure Page
- Back to All Figure Page
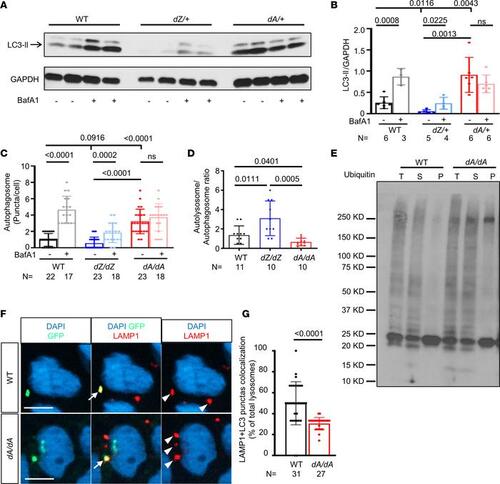
AH in autophagy dysregulation is noted in ttntv models, and autophagic flux is affected by ttntv-A. (A) Representative Western blot of LC3-II from 12-month-old zebrafish hearts. (B) Quantification of A; autophagy is differentially dysregulated in dA/+ vs. dZ/+ fish, with dA/+ showing increased basal LC3-II and impaired autophagic flux, while dZ/+ exhibits reduced basal LC3-II. (C) Quantification of autophagosome puncta in 2 dpf BafA1-treated embryos (Supplemental Figure 7A). (D) Quantification of the autolysosome/autophagosome ratio of 2 dpf non-BafA1-treated embryos (Supplemental Figure 7A). (E) Ubiquitin-conjugated (Ub-conjugated) proteins were moderately increased in detergent-insoluble fractions of dA/dA embryo lysates. The dA/dA fish and WT siblings at 5 dpf were subjected to cell fractionation, and the resulting total lysates (T), soluble fractions (S), and insoluble fractions (P) were analyzed by Western blot using an Ub antibody. The blot is representative of 3 independent experiments. (F) Representative image and quantification of LC3-GFP and lysosome marker LAMP1 colocalization compared with the total LAMP1-stained lysosome. The arrow indicates a yellow puncta with both GFP and LAMP1 that represents colocalization, and the arrowhead indicates a red puncta with only LAMP1. Scale bar: 5 μm. (G) Quantification of F. In this figure, independent samples t test is used. Data are presented as mean ± SD. |