FIGURE SUMMARY
Title

Zebrafish tumour xenograft models: a prognostic approach to epithelial ovarian cancer

Authors
Lindahl, G., Fjellander, S., Selvaraj, K., Vildeval, M., Ali, Z., Almter, R., Erkstam, A., Rodriguez, G.V., Abrahamsson, A., Kersley, Å.R., Fahlgren, A., Kjølhede, P., Linder, S., Dabrosin, C., Jensen, L.
Source
Full text @ NPJ Precis Oncol

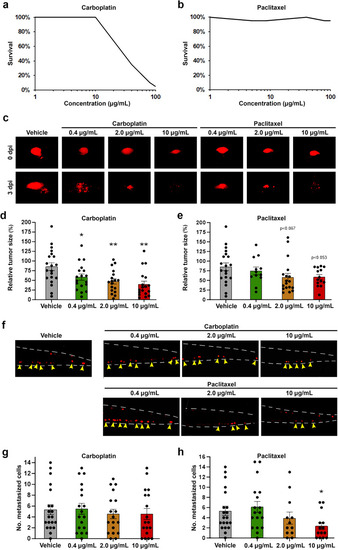
Carboplatin and paclitaxel demonstrate concentration-dependent safety and anti-cancer efficacy in IGROV-1 EOC models.

a, b Curves showing the proportion of embryos surviving treatment with the indicated concentrations of carboplatin (a) or paclitaxel (b) for three days at 36 °C between 2- and 5-days post fertilization. N = 20 embryos per group in three technical replicates. c Representative fluorescent micrographs showing the primary implantation site after fluorescently-labelled IGROV-1 tumour cells (red) were implanted into 2-day-old zebrafish larvae, treated with 0.4–10 µM carboplatin or paclitaxel at 36 °C and imaged at 0 days post implantation (dpi) or 3 dpi. d, e Quantification of relative tumour sizes of IGROV-1 tumour-bearing larvae treated with carboplatin (d) or paclitaxel (e) from the experiment shown in (c). n = 12–20 embryos per group in three technical replicates. *p < 0.05, **p < 0.01. f Representative fluorescent micrographs showing fluorescently-labelled IGROV-1 tumour cells (red) in the metastatic site in the caudal hematopoietic plexus of 5-day-old zebrafish larvae treated with 0.4–10 µM carboplatin or paclitaxel at 36 °C and imaged at 3 dpi. g, h Quantification of the number of metastasized IGROV-1 cells after treatment with carboplatin (g) or paclitaxel (h) from the experiment shown in (f). n = 12–20 embryos per group in three technical replicates. *p < 0.05.

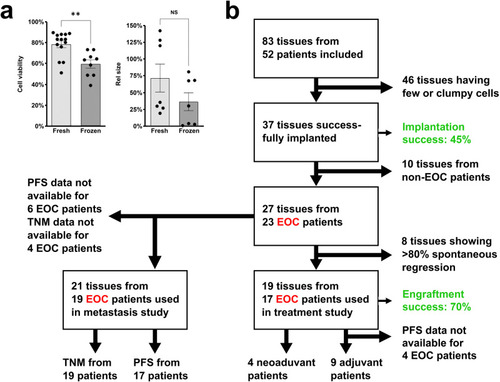
Inclusion and exclusion criteria and handling of patient samples in the clinical study.

a Quantifications of changes in cell viability and tumour size (rel. size) of cells and xenografts, respectively, generated from either fresh or cryopreserved (frozen) tissue samples. n is shown in each graph. NS: non-significant, **p < 0.01. b Flow diagram depicting the number of patients included/excluded for the different sub-studies. All initially included patients had suspected EOC based on radiological images. EOC: Epithelial ovarian cancer; PFS: Progression-free survival; TNM: Tumour-Node-Metastasis.

Implantation of EOC ZTX models in zebrafish larvae.

a Illustration of digestion, staining, implantation, and visualization of EOC tumour samples from primary tumour and metastases transplanted to zebrafish larvae. b Quantification of changes in tumour size (rel. size) between day zero and day three for 19 samples from the primary tumour in 19 patients. Cut-off for included models in further studies was those that decreased less than 80% in size (red dotted line). n is shown as individual dots in the graph. c Quantification of changes in tumour size (rel. size) between day zero and day three for 8 samples from metastatic lesions in 8 patients. Cut-off for including models in further studies were a decrease of less than 80% in size (red dotted line). n is shown as individual dots in the graphs. The experiment was done once. d Comparison of changes in tumour size (rel. size) between samples from primary tumour and samples from metastases transplanted to the zebrafish larvae. The cut-off of less than 80% regression of the tumour size is shown with a red dotted line. *p < 0.05, **p < 0.01. e Comparison of number of cells disseminated to the caudal venous plexus of the zebrafish larvae between samples from primary tumours and samples from metastatic lesions. Red dotted line indicates a cut-off for more or less advanced disease (above or below respectively, see Fig. 4). **p < 0.01. Pat: patient.

Dissemination of tumour cells as a tool for prediction of outcome.

a Illustration of digestion, staining, and imaging of disseminated cells to caudal venous plexus (the area in the black box) of the zebrafish larvae. b Representative images of dissemination in the zebrafish larvae with tumour material from primary tumours of Patient 2 and Patient 4. Yellow arrowheads point to metastasized tumour cells (red). c Quantification of number of disseminated cells in the zebrafish larvae from primary tumours (n = 14, experiment done once) and metastatic lesions (n = 5, experiment done once) compared to patients who had a progression-free survival (PFS) of less than 24 months (red bars) with a cut-off value of 6 (blue dotted line). d Quantification of number of disseminated cells in the zebrafish larvae from primary tumours compared to staging with a cut-off value of 4 (red dotted line). n = 5, n = 9, n = 3, n = 2 for Stage I–II, Stage III A–C, Stage IV A–B, and Stage X (an initially unknown stage that was later confirmed to be Stage IV), respectively. All experiments were done once. Pat: patient.

Treatment outcome in ZTX models is associated with PFS in the corresponding patients.

a Illustration of tumour samples being labelled and injected into the zebrafish larvae. The patients had either been treated with neoadjuvant cytostatic therapy (NACT) before surgery or treated with primary surgery. b Representative images of change in tumour size between day zero and three compared between vehicle group and either carboplatin (10 μg/mL) or paclitaxel (20 μg/mL) in Patient 2. c, d Comparison of change in tumour size in the zebrafish larvae between vehicle group and groups treated with either carboplatin (10 μg/mL) (c) or paclitaxel (20 μg/mL) in samples from either primary tumours or from metastatic lesions in patients treated with primary debulking surgery (PDS). Patients with a progression-free survival (PFS) of less than 24 months are indicated with a red bar. Control tumour size (100%) is indicated by a blue dashed line. All experiments were done once *p < 0.05, **p < 0.01, ***p < 0.001.

Carboplatin and paclitaxel do not inhibit metastasis in patient-derived ZTX models of EOC.

a, b Comparison of changes in average number of disseminated cells (rel. number of metastasized cells) between vehicle and treatment with either carboplatin (10 μg/mL) (a) and paclitaxel (20 μg/mL) (b) in samples from either primary tumours or from metastatic lesions. Patients with a progression-free survival (PFS) of less than 24 months are indicated with a red bar. Dissemination in non-treated controls (100%) is indicated by the blue dashed line. All experiments were done once. *p < 0.05, **p < 0.01, ***p < 0.001. Pat: patient.

Acknowledgments
This image is the copyrighted work of the attributed author or publisher, and ZFIN has permission only to display this image to its users. Additional permissions should be obtained from the applicable author or publisher of the image. Full text @ NPJ Precis Oncol