IMAGE

Fig. 2

ID
ZDB-IMAGE-240229-145
Source
Figures for Lindahl et al., 2024
Image
Figure Caption

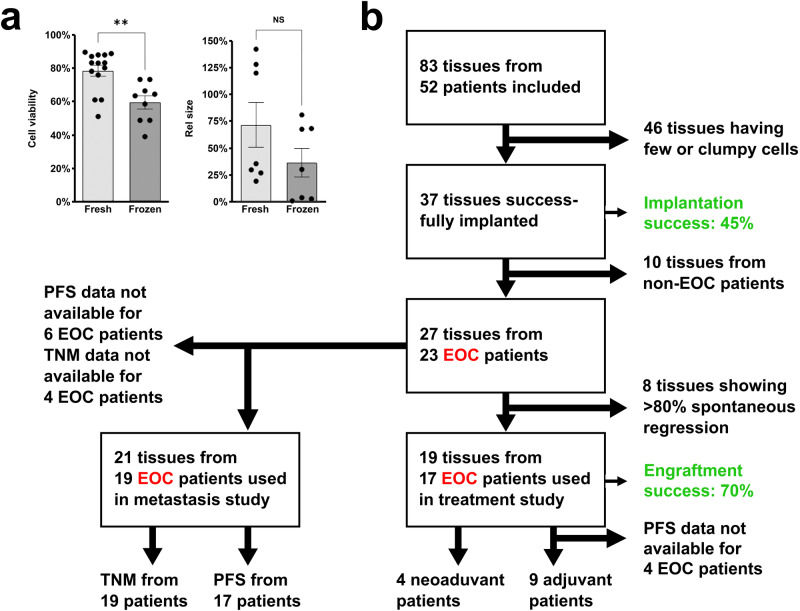
Fig. 2 Inclusion and exclusion criteria and handling of patient samples in the clinical study.

a Quantifications of changes in cell viability and tumour size (rel. size) of cells and xenografts, respectively, generated from either fresh or cryopreserved (frozen) tissue samples. n is shown in each graph. NS: non-significant, **p < 0.01. b Flow diagram depicting the number of patients included/excluded for the different sub-studies. All initially included patients had suspected EOC based on radiological images. EOC: Epithelial ovarian cancer; PFS: Progression-free survival; TNM: Tumour-Node-Metastasis.

Acknowledgments
This image is the copyrighted work of the attributed author or publisher, and ZFIN has permission only to display this image to its users. Additional permissions should be obtained from the applicable author or publisher of the image. Full text @ NPJ Precis Oncol