IMAGE

Fig. 3

ID
ZDB-IMAGE-240229-146
Source
Figures for Lindahl et al., 2024
Image
Figure Caption

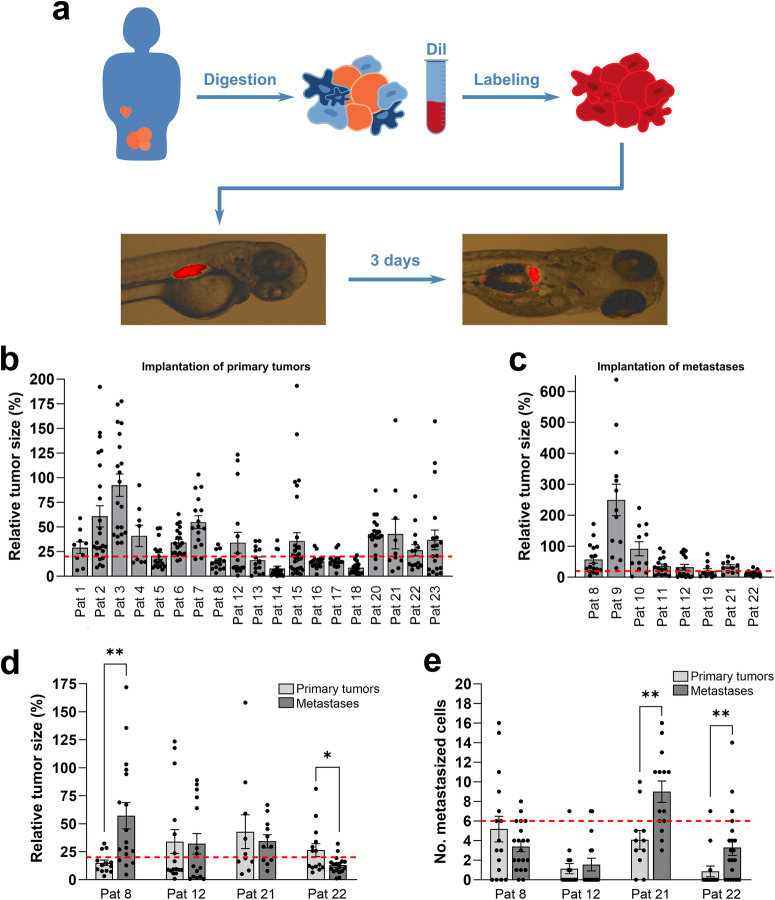
Fig. 3 Implantation of EOC ZTX models in zebrafish larvae.

a Illustration of digestion, staining, implantation, and visualization of EOC tumour samples from primary tumour and metastases transplanted to zebrafish larvae. b Quantification of changes in tumour size (rel. size) between day zero and day three for 19 samples from the primary tumour in 19 patients. Cut-off for included models in further studies was those that decreased less than 80% in size (red dotted line). n is shown as individual dots in the graph. c Quantification of changes in tumour size (rel. size) between day zero and day three for 8 samples from metastatic lesions in 8 patients. Cut-off for including models in further studies were a decrease of less than 80% in size (red dotted line). n is shown as individual dots in the graphs. The experiment was done once. d Comparison of changes in tumour size (rel. size) between samples from primary tumour and samples from metastases transplanted to the zebrafish larvae. The cut-off of less than 80% regression of the tumour size is shown with a red dotted line. *p < 0.05, **p < 0.01. e Comparison of number of cells disseminated to the caudal venous plexus of the zebrafish larvae between samples from primary tumours and samples from metastatic lesions. Red dotted line indicates a cut-off for more or less advanced disease (above or below respectively, see Fig. 4). **p < 0.01. Pat: patient.

Acknowledgments
This image is the copyrighted work of the attributed author or publisher, and ZFIN has permission only to display this image to its users. Additional permissions should be obtained from the applicable author or publisher of the image. Full text @ NPJ Precis Oncol