- Title
-
Requirement of a novel gene, drish, in the zebrafish retinal ganglion cell and primary motor axon development
- Authors
- Gurung, S., Restrepo, N.K., Anand, S.K., Sittaramane, V., Sumanas, S.
- Source
- Full text @ Dev. Dyn.
|
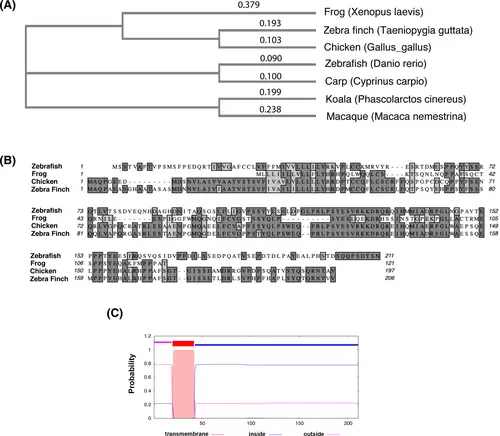
Drish conservation between different species and structure prediction. (A) The phylogenetic tree analysis of Drish proteins from different species. The cladogram of Neighbor-joining tree without distance corrections was generated using Clustal Omega multiple sequence alignment tool at EMBL-EBI.68 (B) Alignment between amino acid sequences of the Danio rerio Drish and amino acids from three other species is shown. The dark gray highlight shows identical amino acid residues, while light gray highlight shows similar amino acid residues between different species. The amino acid sequence alignment was performed using MacVector 18.0 software. The following sequences were used for alignments in (A, B): Cyprinus carpio XP_042576826; Gallus gallus XP_429916.4; Macaca nemestrina XP_011723858.1; Phascolarctos cinereus XP_020828228.1; Taeniopygia guttata XP_030143607.1; Xenopus laevis XELAEV_18044022mg; Danio rerio XP_009298140.1. (C) The transmembrane helices were analyzed by TMHMM2.0 software.35 The graphical output shows the posterior probabilities for outside (luminal, aa 1 to aa 21), transmembrane (aa 22 to aa 42), and inside (cytoplasmic, aa 43 to aa 211) regions. |
|
drish expression pattern analysis in zebrafish by whole-mount in situ hybridization. (A) drish was restricted to the nervous system (white asterisk) in the head at 5-somite (11.5 hpf) stage. (B–D) At the 11-somite (14.5 hpf) stage, drish was expressed in the forebrain including the eye field (yellow asterisk), anterior cephalic mesoderm (ACM), midbrain and hindbrain (marked by a bracket), endothelial progenitor cells (EPCs), and neural plate (NP). (E) At 18 hpf, drish was broadly expressed in the cranial neural region, while it was restricted to vascular endothelial cells (arrowhead) and the spinal cord (arrow) in the trunk. (F, G) drish expression was absent from vascular endothelial cells in etv2−/− mutants (arrowhead). (H) At 24 hpf, drish was expressed in the brain, spinal cord (arrow), and the dorsal aorta (arrowhead). (I–L) By 28 and 35 hpf, drish was primarily expressed in the brain and spinal cord (arrow, L). Note drish expression in the brain (arrowheads) adjacent to the retinal pigmented epithelium (RPE). Scale bars: 100 μm. Scale bar in E for E-G. Lateral views in all panels, except for (C, D), which is a flat-mounted embryo, dorsal view, and (J, K), which are dorsal views. (M) Analysis of drish expression in the previously published Daniocell single-cell RNA-seq dataset.42 Only cell types with any significant drish expression are shown. Note its strong expression in retinal progenitors/Müller glia precursors at 14–21 hpf stages. The figure was made using Daniocell analysis tool https://daniocell.nichd.nih.gov/ and subsequently edited. |
|
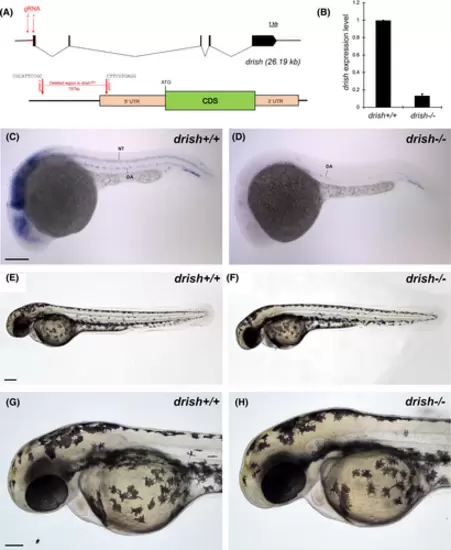
Generation of promoter-less drish mutant using CRISPR/Cas9. (A) Schematic diagram showing the targeting sites of two gRNAs (red arrows). gRNA 1 targeted the 5′UTR region of drish gene, while gRNA 2 targeted ~800 bp upstream of the 5′UTR region. The lower diagram shows drish mutant allele (drishci51) with a 797 bp deletion and the adjacent junctional sequence. (B) qPCR analysis showed a significant reduction of drish in drish−/− mutant embryos compared to drish+/+ embryos at 3 dpf. (C, D) WISH showed a significant reduction of drish mRNA in drish−/− mutant embryo at 24 hpf. Lateral view with anterior to the left is shown. Note the absence of neural expression but presence of some endothelial expression. (E–H) Brightfield images of drish mutant and control wild-type embryos at 48 hpf. (G, H) show higher magnification view of the anterior portion of an embryo. No apparent morphological defects were observed. Scale bars: 100 μm. |
|
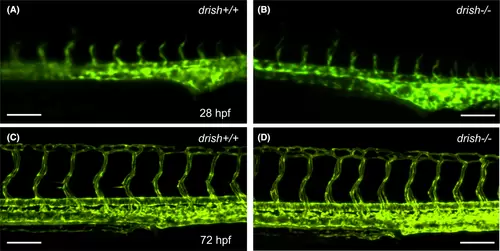
drish mutants do not show defects in vascular patterning. (A–D) Confocal images of Tg(kdrl:GFP) expression in drish+/+ and drish−/− mutant embryos at 28 and 72 hpf using ×20 and ×10 objectives. drish−/− mutants exhibit normal vascular patterning (B, D), similar to drish+/+ embryos (A, C). Scale bars: 100 μm. |
|
drish mutants show defects in the formation of the retinal ganglion cells, optic nerve and inner nuclear layer. (A, B, D, E) Confocal imaging of drish+/+ and drish−/− embryos processed for zn8 immunostaining at 2 dpf (A, B) and 4 dpf (D, E) to label RGC and optic nerve. The optic nerve appeared thinner in drish−/− mutant embryos compared to drish+/+ embryos at 2 dpf but no difference was observed at 4 dpf. Ventral view of the head region with anterior to the top is shown. Arrows denote the location where diameter measurements were taken. Asterisks in A and B denote retina. Note the reduced zn8 staining in the retina of drish−/− embryos. Scale bar, 50 μm. (C, F) Quantification of the optic nerve diameter at 2 and 4 dpf in individual drish+/+ and drish−/− embryos, respectively. Data pooled from two experiments, n = 20 (+/+) and 30 (−/−) at 2 dpf and n = 20 (+/+) and 33 (−/−) at 4 dpf. **p < 0.01, ns, not significant, Student's t-test. (G, H) Anti-caspase 3 immunofluorescence for apoptotic cells in drish+/+ and drish−/− embryos at 24 hpf. Maximum intensity limited projection of the eye area is shown. No apparent increase in apoptosis was observed in the mutant embryos (n = 20 for wt and 40 for mutant embryos, two replicate experiments). (I, J) H&E stained coronal sections of drish+/+ (I) and drish−/− (J) larval retina at 5 dpf were observed to analyze disruptions in granule cell layer, inner nuclear layer, photoreceptor layer, optic nerve pathfinding and optic chiasma formation. drish−/− larvae displayed normal morphology of retina with granule cell layer (GCL), inner plexiform layer (IPL), photoreceptor layer (PR), retinal pigmented epithelium (RPE), choroid (CH), optic nerve (ON) and optic chiasma (OC). However, the inner nuclear layer (INL) appeared thinner in the mutant larvae. (K–M) Quantification of cell number in granular, inner nuclear, and photoreceptor layers. No difference in the number of GCL and PR cells was observed between drish−/− and drish+/+ larvae. However, the number of cells in the inner nuclear layer (INL) of drish−/− retina was significantly reduced (Student's one-tailed t-test, p < 0.05) compared to drish+/+ retina (n = 5). |
|
Immunostaining for photoreceptor marker expression. (A, B) Immunostaining using anti-Rhodopsin antibody Rho4D2 does not show significant changes in drish−/− compared to wild-type larvae at 5 dpf. Ventral view, imaged by confocal microscopy. (C) Quantification of staining intensity in drish−/− and +/+ larvae. ns, not significant, Student's t-test. (D, E) Immunostaining using cone-specific Zpr1 antibody does not show significant changes in drish−/− larvae compared to wild-type at 5 dpf. Lateral view of the eye, imaged by confocal microscopy. Selected slices were combined using maximal-intensity projection. (F) Quantification of staining intensity in drish−/− and +/+ larvae. ns, not significant, Student's t test. |
|
In situ hybridization analysis of markers associated with RGC differentiation. (A–L) WISH analysis of isl1a, irx1a, lhx3, atoh7, and shh expression in drish+/+ and −/− embryos at 33 or 48 hpf. Retina specific expression (arrows) of all markers except for shh was reduced in a subset of drish−/− embryos. Scale bar, 50 μm. (M) Quantification of WISH marker expression. Percentage of wild-type drish+/+ and mutant drish−/− embryos that display retinal expression defects is shown in orange. Data are summary of two independent experiments. The total number of embryos analyzed is shown at the bottom of each bar. ***p < 0.001, Fisher's exact test; NS, not significant. |
|
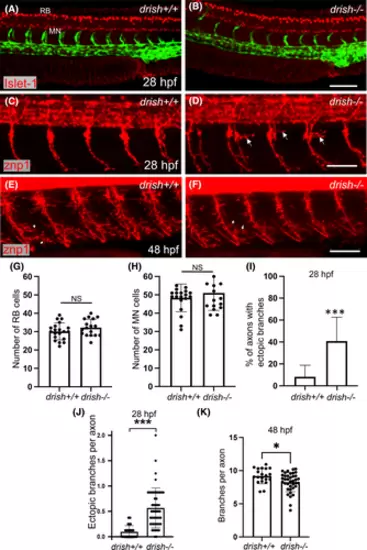
Analysis of Rohon-Beard (RB) neurons and spinal motor neurons (MNs) in drish mutants. (A, B) Confocal imaging of drish+/+ and drish−/− embryos in Tg(fli1a:GFP) background processed for Islet-1 immunostaining at 28 hpf, which labels RB neurons and spinal MNs. Lateral view of trunk region with anterior to the left shown. Scale bar, 100 μm. (C–F) Immunostaining for Znp-1 at 28 and 48 hpf, which labels primary motor neurons. drish−/− mutants exhibited ectopic axon branching of caudal primary motor neurons and the formation of peripheral branches at 28 hpf (arrows, D). In contrast, the number of peripheral branches of CaP neurons was reduced at 48 hpf (arrows, E, F). Scale bar, 50 μm. (G, H) Quantification of RB neurons and spinal MNs at 28 hpf. n = 20 for drish+/+ and n = 17 for drish−/− embryos. No difference in the number of RB neurons (average number of RB neurons in drish+/+: 30.2 and drish−/−: 32.2, p = 0.17, Student's t-test) and spinal MNs (average number of spinal MNs in drish+/+: 48.4 and drish−/−: 51, p = 0.34, Student's t-test) was observed between drish+/+ and drish−/− embryos. NS, not significant. (I–K) Quantification of axon branching defects in drish−/− mutants at 28 and 48 hpf. Percentage of axons with ectopic branches in each embryo and the number of ectopic branches per axon at 28 hpf are shown in (I, J), while the total number of peripheral branches per ventral segment of an axon at 48 hpf is shown in (K). n = 35 for drish+/+ and n = 48 for drish−/− at 28 hpf (I, J); n = 20 and 40 for drish+/+ and −/− embryos, respectively, at 48 hpf (K). The number of embryos analyzed was combined from two independent experiments. ***p < 0.0001, *p < 0.05, Student's two-tailed t-test (J, K), Fisher's exact test performed using absolute numbers of axon counts (I). |
|
drish−/− mutant larvae exhibit impaired light-induced locomotor activity while touch-evoked escape response is unaffected. (A–D) Light-induced and dark-induced swimming activity analysis performed using 5 dpf larvae. (A) Schematic of lights on/ off swimming assay. (B) The total distance moved throughout the assay (duration: 20 min) was similar between drish+/+ and drish−/− mutant larvae. NS, not significant, Student's t-test. (C) Total distance moved in response to light stimuli (duration: 1 min) was significantly reduced in drish−/− mutants compared to drish+/+ larvae (**p < 0.001, Student's t-test). (D) The total distance moved in response to dark stimuli (duration: 1 min) was similar between drish−/− mutants and drish+/+ larvae. n = 48 for drish+/+ and drish−/− larvae. NS, not significant, Student's t-test. (E, F) Touch response assay using 2 dpf embryos. Touch-evoked escape response following a single touch to either the head (E) or the trunk (F) was compared between drish+/+ and drish−/− mutant embryos. Responses were divided into three categories: No response (no movement after touch), Weak response (subtle movement with larva remaining within the field of view), and Strong response (rapid movement with larva exiting the field of view). Drish−/− mutants responded similarly to control drish+/+ larvae when touched in the head or the trunk. Data pooled from four experiments, n = 61 for drish+/+ and n = 62 for drish−/− embryos, NS, not significant, Chi-square test. |
|
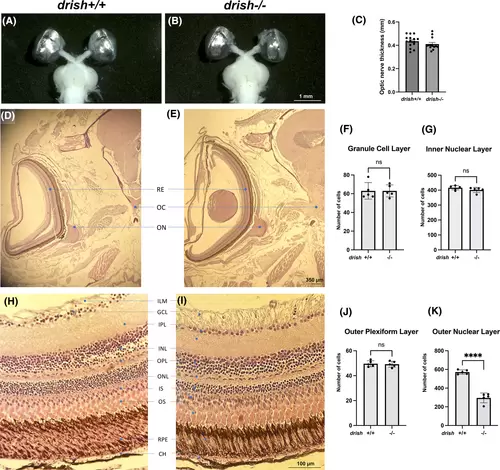
Analysis of brain preparations and histological sections in drish mutant and wild-type sibling adults. (A–C) Brains and eyes were dissected from approximately 1-year old adults and the optic nerve diameter was measured. No significant difference between drish−/− (n = 13) and drish+/+ (n = 15) sibling adults was observed (Student's t-test, p > 0.05). (D, E) H&E stained coronal sections of drish+/+ (D) and drish−/− (E) head were observed to analyze morphology of optic nerve pathfinding and optic chiasma formation in approximately 2.5-year old adult zebrafish. No significant difference was observed (n = 5 fish for each genotype). (F–K) H&E stained coronal sections of drish+/+ (H) and drish−/− (I) adult retina were observed to analyze disruptions in different layers of cells within retina. No difference in the number of cells in the granule cell layer (F), inner nuclear layer (G) or outer plexiform layer (J) was observed. However, the number of cells in the outer nuclear layer of drish−/− retina was significantly reduced (Student's t-test, ****p < 0.001) compared to drish+/+ retina (K). BR, brain; CH, choroid; GCL, ganglion cell layer; ILM, inner limiting membrane; INL, inner nuclear layer; IPL, inner plexiform layer; IS and OS, inner and outer segments of photoreceptors; OC, optic chiasma; ON, optic nerve; ONL, outer nuclear layer; RE, retina; RPE, retinal pigment epithelium; PR, photoreceptor layer. |
|
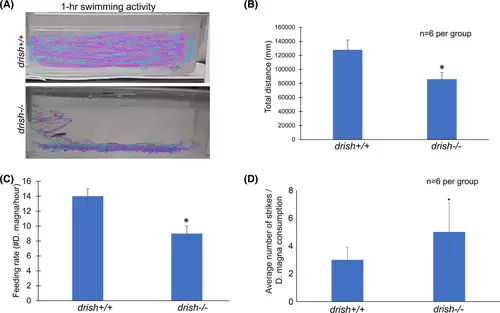
drish−/− mutant adults exhibit impaired locomotor activity and poor feeding. (A) Representative swimming traces of individual drish+/+ and drish−/− zebrafish adults. (B) Total distance moved by drish+/+ and drish−/− adult zebrafish. drish−/− adults moved significantly less than drish+/+ adults (n = 6 per group; Student's t-test, p < 0.0001). (C) Feeding rate between drish+/+ and drish−/− adult zebrafish was compared. Drish−/− adults showed decreased feeding rate compared to drish+/+ adults (n = 6, Student's t-test, p < 0.001). (D) Average number of strikes per consumption of each D. magna. Note that drish+/+ fish were able to consume a D. magna in an average of 3 strikes, whereas drish−/− fish took an average of 5 strikes to successfully consume a D. magna (n = 6, Student's t-test, p-value <0.001). |

