
- Title
-
The direct impact of pegvisomant on osteoblast functions and bone development
- Authors
- Vitali, E., Grasso, A., Schiavone, M.L., Trivellin, G., Sobacchi, C., Mione, M., Mazziotti, G., Lania, A.
- Source
- Full text @ J. Endocrinol. Invest.
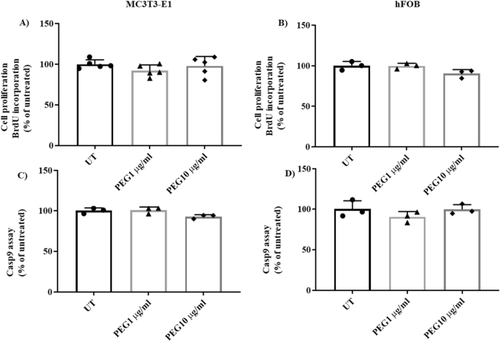
PEG impact on MC3T3-E1 and hFOB cell proliferation, apoptosis, and viability. A MC3T3-E1 and B hFOB cells were stimulated with PEG at 1 and 10 μg/ml for 48 h. Subsequently, cells were incubated with BrdU for 2 h. Untreated cells were used as control (UT). C, D MC3T3-E1 and hFOB cells were treated with PEG 1 and 10 μg/ml for 48 h. Apoptosis was detected by measuring Caspase-9 enzymatic activity. Values represent the mean ± SD of three experiments. Statistical analysis was performed with One-Way ANOVA followed by Dunnett’s post-hoc test |
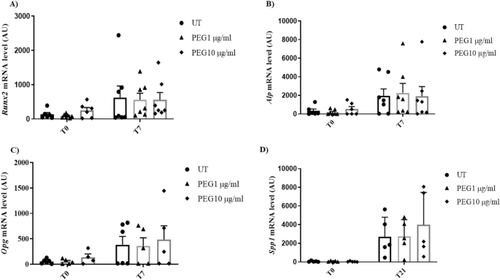
Effect of PEG on murine osteoblastogenesis. A–C Osteoblast marker genes Runx2, Alp, and Opg were assessed by quantitative real-time polymerase chain reaction (RT-qPCR) at 0 and 7 days of differentiation. Statistical analysis was performed with two-way ANOVA followed by Sidak's multiple comparisons test |
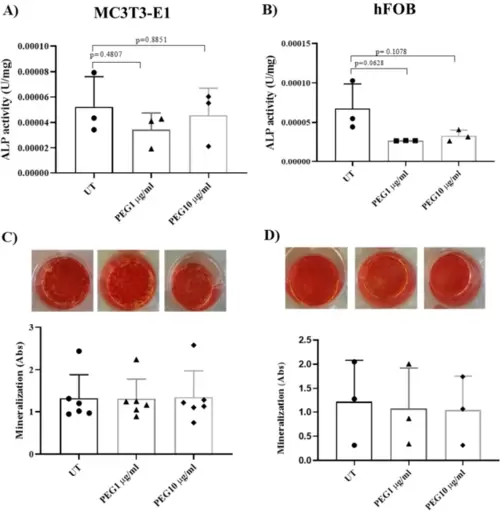
Effects of PEG on ALP activity and mineralization by ARS staining. A, B After 7 days of culture in the presence or absence of PEG (1 and 10 μg/ml), ALP activity (U) was measured in MC3T3-E1 and hFOB cells. No effect of PEG on ALP activity was observed. Data are expressed as U/mg proteins. U = µmol/minutes. Experiments were repeated at least 3 times and each determination was done in triplicate. Statistical analysis was performed with One-Way ANOVA followed by Dunnett’s post-hoc test. C, D MC3T3-E1 cells and hFOB were incubated in an OIM medium with PEG for 21 days. Untreated (UT) cells served as control. After fixation, cells were stained with Alizarin red solution and then quantified with a spectrophotometer at 405 nm wavelength. No effect of PEG on mineralization was observed |
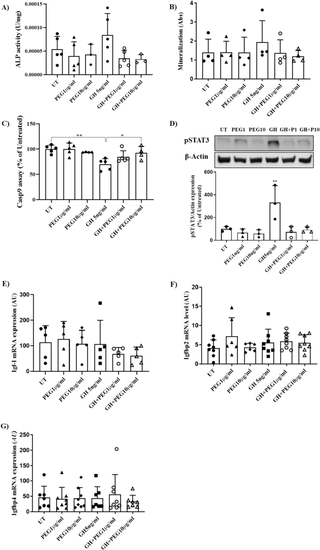
Evaluation of the combined effect of GH and PEG on OB function. A MC3T3-E1 cells were incubated with PEG (1, 10 μg/ml) alone or in combination with GH (5 ng/ml) for 7 days. Subsequently, ALP activity (U) was measured. B MC3T3-E1 cells were incubated with PEG (1,10 μg/ml) alone or in combination with GH (5 ng/ml) in OIM for 21 days and calcium mineralization was evaluated by Alizarin Red staining. C MC3T3-E1 cells were incubated with PEG (1,10 μg/ml) alone or in combination with GH (5 ng/ml) for 48 h. Apoptosis was performed by measuring Caspase-9 enzymatic activity. Values represent mean ± SD of 3 experiments. ** = p < 0.01, vs corresponding untreated (UT), * = p < 0.5 vs GH + PEG 10 μg/ml. Statistical analysis was performed with a One-Way ANOVA test followed by Dunnett’s post-hoc test. *** = p < 0.001. D MC3T3-E1 cells were incubated with PEG (1,10 μg/ml) alone or in combination with GH (5 ng/ml) for 3 h. Representative immunoblots show that the increase in STAT3 phosphorylation induced by GH was abolished by PEG incubation in MC3T3-E1 cells. The graphs show the quantification of STAT3 phosphorylation (pSTAT3) normalized to β-Actin expression (mean value ± SD from 3 independent experiments). ** = p < 0.01, vs corresponding untreated (UT). E–G MC3T3-E1 cells were incubated with PEG (1, 10 μg/ml) alone or in combination with GH (5 ng/ml) for 24 h. RNA was isolated from MC3T3-E1 cells, followed by cDNA generation, and RT-qPCR was performed for the Igf-I, Igfbp2, and Igfbp4 genes. The analysis of relative gene expression was carried out according to the comparative 2–ΔCt method and the normalized expression was calculated as arbitrary units (AU) |
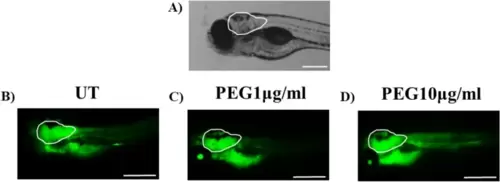
Visualization of the cranial bone region of 5 dpf zebrafish larvae by calcein staining. Zebrafish larvae (2 dpf) were treated with PEG at 1 μg/ml and 10 μg/ml for 3 days. At 5 dpf, zebrafish larvae were stained with 0.2% Calcein solution for 10 min. The fluorescent signal of calcein was observed using fluorescence microscopy. Side view of the cranial bone region marked with white contour. A Representative bright-field image of zebrafish larvae at 5 dpf (scale bar 240 µm). B–D No significant differences were observed between untreated and PEG-treated larvae (scale bar 500 µm) |