
Image
|
Figure Caption
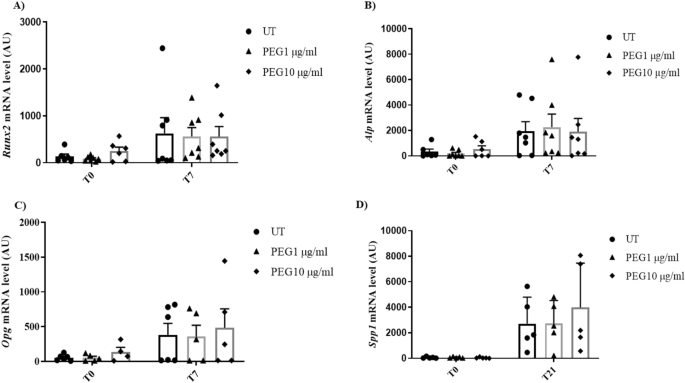
Fig. 2 Effect of PEG on murine osteoblastogenesis. A–C Osteoblast marker genes Runx2, Alp, and Opg were assessed by quantitative real-time polymerase chain reaction (RT-qPCR) at 0 and 7 days of differentiation. Statistical analysis was performed with two-way ANOVA followed by Sidak's multiple comparisons test
Acknowledgments
This image is the copyrighted work of the attributed author or publisher, and
ZFIN has permission only to display this image to its users.
Additional permissions should be obtained from the applicable author or publisher of the image.
Full text @ J. Endocrinol. Invest.