
Image
|
Figure Caption
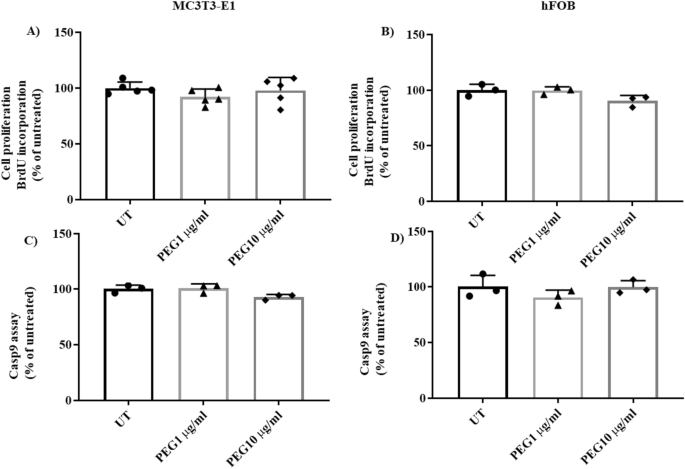
Fig. 1 PEG impact on MC3T3-E1 and hFOB cell proliferation, apoptosis, and viability. A MC3T3-E1 and B hFOB cells were stimulated with PEG at 1 and 10 μg/ml for 48 h. Subsequently, cells were incubated with BrdU for 2 h. Untreated cells were used as control (UT). C, D MC3T3-E1 and hFOB cells were treated with PEG 1 and 10 μg/ml for 48 h. Apoptosis was detected by measuring Caspase-9 enzymatic activity. Values represent the mean ± SD of three experiments. Statistical analysis was performed with One-Way ANOVA followed by Dunnett’s post-hoc test
Acknowledgments
This image is the copyrighted work of the attributed author or publisher, and
ZFIN has permission only to display this image to its users.
Additional permissions should be obtained from the applicable author or publisher of the image.
Full text @ J. Endocrinol. Invest.