
Fig. 4
- ID
- ZDB-FIG-240620-19
- Publication
- Vitali et al., 2023 - The direct impact of pegvisomant on osteoblast functions and bone development
- Other Figures
- All Figure Page
- Back to All Figure Page
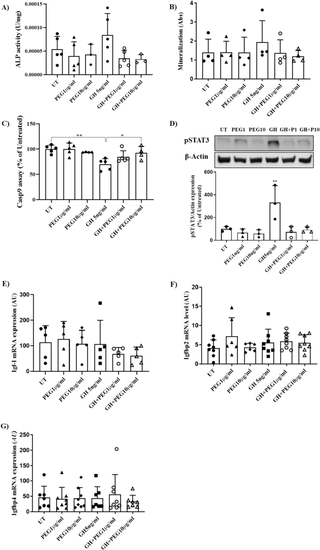
Evaluation of the combined effect of GH and PEG on OB function. A MC3T3-E1 cells were incubated with PEG (1, 10 μg/ml) alone or in combination with GH (5 ng/ml) for 7 days. Subsequently, ALP activity (U) was measured. B MC3T3-E1 cells were incubated with PEG (1,10 μg/ml) alone or in combination with GH (5 ng/ml) in OIM for 21 days and calcium mineralization was evaluated by Alizarin Red staining. C MC3T3-E1 cells were incubated with PEG (1,10 μg/ml) alone or in combination with GH (5 ng/ml) for 48 h. Apoptosis was performed by measuring Caspase-9 enzymatic activity. Values represent mean ± SD of 3 experiments. ** = p < 0.01, vs corresponding untreated (UT), * = p < 0.5 vs GH + PEG 10 μg/ml. Statistical analysis was performed with a One-Way ANOVA test followed by Dunnett’s post-hoc test. *** = p < 0.001. D MC3T3-E1 cells were incubated with PEG (1,10 μg/ml) alone or in combination with GH (5 ng/ml) for 3 h. Representative immunoblots show that the increase in STAT3 phosphorylation induced by GH was abolished by PEG incubation in MC3T3-E1 cells. The graphs show the quantification of STAT3 phosphorylation (pSTAT3) normalized to β-Actin expression (mean value ± SD from 3 independent experiments). ** = p < 0.01, vs corresponding untreated (UT). E–G MC3T3-E1 cells were incubated with PEG (1, 10 μg/ml) alone or in combination with GH (5 ng/ml) for 24 h. RNA was isolated from MC3T3-E1 cells, followed by cDNA generation, and RT-qPCR was performed for the Igf-I, Igfbp2, and Igfbp4 genes. The analysis of relative gene expression was carried out according to the comparative 2–ΔCt method and the normalized expression was calculated as arbitrary units (AU) |