
FIGURE
Fig. 5
- ID
- ZDB-FIG-240620-20
- Publication
- Vitali et al., 2023 - The direct impact of pegvisomant on osteoblast functions and bone development
- Other Figures
- All Figure Page
- Back to All Figure Page
Fig. 5
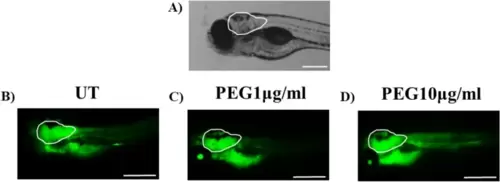
Visualization of the cranial bone region of 5 dpf zebrafish larvae by calcein staining. Zebrafish larvae (2 dpf) were treated with PEG at 1 μg/ml and 10 μg/ml for 3 days. At 5 dpf, zebrafish larvae were stained with 0.2% Calcein solution for 10 min. The fluorescent signal of calcein was observed using fluorescence microscopy. Side view of the cranial bone region marked with white contour. A Representative bright-field image of zebrafish larvae at 5 dpf (scale bar 240 µm). B–D No significant differences were observed between untreated and PEG-treated larvae (scale bar 500 µm) |
Expression Data
Expression Detail
Antibody Labeling
Phenotype Data
Phenotype Detail
Acknowledgments
This image is the copyrighted work of the attributed author or publisher, and
ZFIN has permission only to display this image to its users.
Additional permissions should be obtained from the applicable author or publisher of the image.
Full text @ J. Endocrinol. Invest.