FIGURE SUMMARY
Title

Inhibition of the membrane repair protein annexin-A2 prevents tumor invasion and metastasis

Authors
Gounou, C., Rouyer, L., Siegfried, G., Harté, E., Bouvet, F., d'Agata, L., Darbo, E., Lefeuvre, M., Derieppe, M.A., Bouton, L., Mélane, M., Chapeau, D., Martineau, J., Prouzet-Mauleon, V., Tan, S., Souleyreau, W., Saltel, F., Argoul, F., Khatib, A.M., Brisson, A.R., Iggo, R., Bouter, A.
Source
Full text @ Cell. Mol. Life Sci.

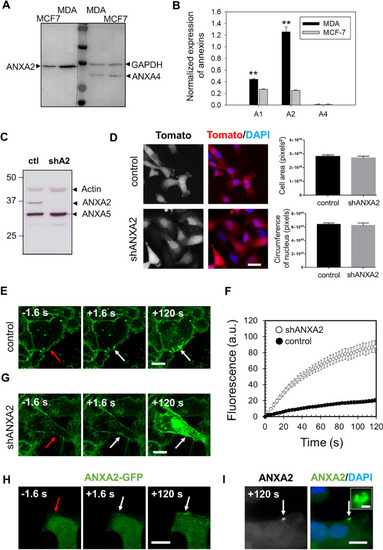
Highly expressed in MDA-MB-231 cells, ANXA2 promotes membrane repair. A Representative image of western-blot analysis showing the revelation of ANXA2 in MDA-MB-231 and MCF7 cells, as compared to GAPDH (loading control). B The histogram presents mean values (± SEM) of the ratio ANX/GAPDH from five independent experiments, analyzed by the gel analysis plugging of ImageJ. A representative membrane of the detection of ANXA1 is presented in supplementary Fig. S1. Student t test for independent samples. **p < 0.01. C ANXA2-deficient MDA-MB-231 cells were generated by shRNA transduction strategy. The cellular content of ANXA2 in MDA-MB-231 cells transduced with lentiviral particles containing shRNA targeting ANXA2 (shA2) or a scrambled shRNA (ctl) was quantified by Western blotting. D Control and shANXA2 MDA-MB-231 cells, which expressed constitutively the tdTomato fluorescent protein were imaged by fluorescence microscopy. Right-hand histograms display mean cell area (in pixels2) and nuclei circumference (in pixels) measured by the imageJ software using Tomato and DAPI images. The mean values (+ / − SEM) were calculated from at least 30 cells from three independent experiments. No statistical difference (student t test) was observed for the two parameters. Scale bar: 20 µm. E, G Sequences of representative images showing the response of a control (E) or shANXA2 (G) MDA-MB-231 cell to a membrane damage performed by 110-mW infrared laser irradiation, in the presence of FM1-43 (green). In all figures, the area of membrane irradiation is marked with a red arrow before irradiation and a white arrow after irradiation. Scale bars: 10 μm. F Kinetic data represent the FM1 − 43 fluorescence intensity for control (black filled circles) or shANXA2 (empty circles) MDA-MB-231 cells, integrated over whole cell sections, averaged for about 30 cells (+ / − SEM). H Recruitment of ANXA2 to the site of membrane injury. MDA-MB-231 cells transfected with the plasmid pA2-GFP were damaged by laser ablation. Red arrow, area before irradiation; white arrow, area after irradiation. I Subcellular localization of endogenous ANXA2 in damaged MDA-MB-231. MDA-MB-231 cells were irradiated with a 110-mW infrared laser (white arrow) in DPBS + Ca2+, then fixed and immunostained for ANXA2 and counterstained with DAPI (blue). After laser injury, MDA-MB-231 cells exhibited an accumulation of ANXA2 at the disruption site. The inset displays a magnified image of the disruption site where concentrates ANXA2. Scale bars: 10 µm on the images and 1 µm within the inset

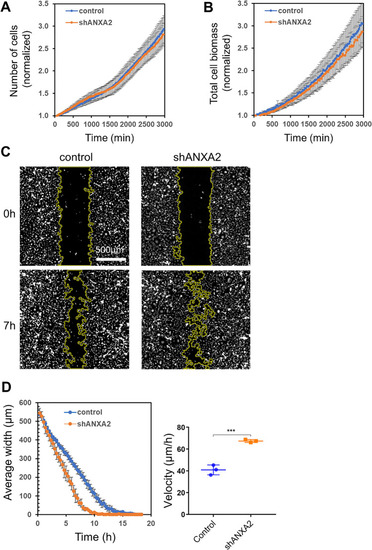
Proliferation and 2D-migration of MDA-MB-231 cells are independent of ANXA2. A, B Proliferation of control or shANXA2 MDA-MB-231 cells was monitored with a lensfree microscope enabling long-term observation of a large cell population [45]. A Averaged number of cells (± SEM) normalized to the number of seeded cells from three independent experiments. B Normalized total cell biomass (± SEM), which considers individual number and cell size, from three independent experiments. C, D In vitro 2D-migration assay was performed on control or shANXA2 MDA-MB-231 cells. Cells were plated into culture-Insert 2-well in 35 mm µ-Dish (Ibidi) coated with 0.5 mg/mL gelatin. Cell progression was monitored with a lensfree microscope, after removing the culture insert. C Typical images of control or shANXA2 MDA-MB-231 cells immediately or 7h after insert release are presented. Migration front is drawn in yellow. D Mean gap closure kinetics and cell velocity measure (± SEM) from three independent experiments are presented for each cell type. Nonparametric Mann–Whitney test. ***p < 0.001

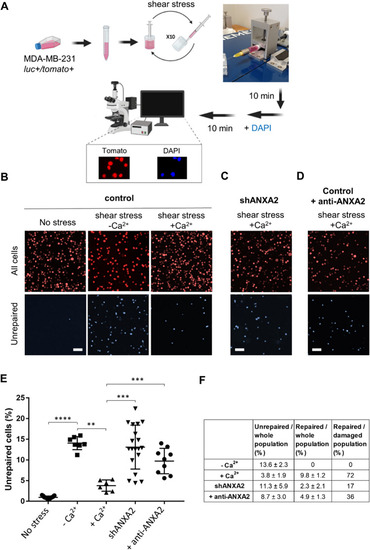
Response of control or shANXA2 MDA-MB-231 cells to membrane injury by shear-stress treatment. A Scheme of the protocol with a photography of the device used for the automatized shear-stress treatment. Cells were loaded in a 1 mL syringe with a 30G needle mounted on a fully automated syringe pump system. After 10 passages through the needle, cells were incubated with DAPI, which stained damaged/unrepaired cells, while all cells expressed the fluorescent protein tdTomato. Created using Biorender.com. B Representative images of control unstressed MDA-MB-231 (left-hand panels), and stressed cells in the absence (middle panels) or presence (right-hand panels) of 2 mM Ca2+. Scale bars: 50 µm. C Representative images of shANXA2 MDA-MB-231 submitted to the shear stress assay in the presence of 2 mM Ca2+. Scale bar: 50 µm. D Representative images of control MDA-MB-231 submitted to shear stress assay in the presence of 2 mM Ca2+ and monoclonal anti-ANXA2 antibody (1:50, Sigma-Aldrich). Scale bar: 50 µm. E DAPI-positive unrepaired cells over the whole cell population (tdTomato-positive), were quantified for at least 6 independent experiments. Experimental data together with mean (± SEM) are presented. Nonparametric Mann − Whitney test. **P value (< 0.01), ***P value (< 0.001), ****P value (< 0.0001). F Mean percentage of unrepaired cells represented in E are indicated in the second column. Mean percentage of “repaired cells over the whole cell population” (column 3) is calculated by subtracting the “unrepaired / whole cell population” rate to 13.6%, which corresponds to the rate of damaged and unrepaired cells in the absence of Ca2+ that prevents membrane resealing. “Repaired / damaged population” rate (column 4) is calculated as the percentage of repaired cells considering that the number of damaged cells is 13.6

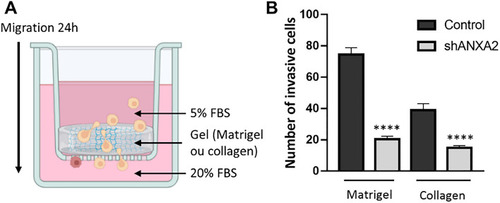
ANXA2 deficiency impairs MDA-MB-231 cell invasion. A Matrigel or dense collagen gel was produced into a transwell and cells were seeded in media with 5% FBS on top of the gel. As chemoattractant, 20% FBS-containing medium was added in the bottom of the well to allow cell invasion through the gel. Created using Biorender.com. B Number of control or shANXA2 MDA-MB-231 cells able to cross the gel was quantified. Unpaired Student’s t test. ****p < 0.0001

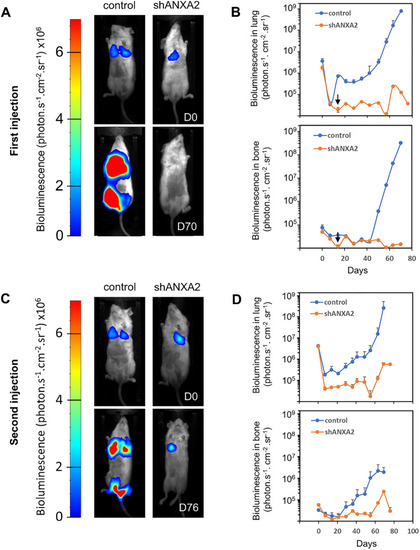
Genetic inhibition of ANXA2 prevents tissue colonization of MDA-MB-231 cells in NOD SCID mice. A Control or shANXA2 MDA-MB-231 cells were injected in NOD SCID mice as described in the legend of the Supplementary Fig. S10. Representative bioluminescence images of NOD SCID mice 30 min (D0) or 70 days (D70) after injection of MDA-MB-231 cells are presented. B Bioluminescence quantification in lungs and bone for control (n = 5) or shANXA2 (n = 5) MDA-MB-231 cells. The black arrow points the time when some mice (n = 4), initially injected with shANXA2 MDA-MB-231 cells and exhibiting low signal in bioluminescence imaging, were injected with control (n = 2) or ANXA2 shRNA (n = 2) MDA-MB-231 cells. C Representative bioluminescence images of NOD SCID mice, initially injected with shANXA2 MDA-MB-231 cells and, injected a second time with either control or shANXA2 MDA-MB-231 cells, at 30 min (D0) or 76 days (D76) after the second injection. D Bioluminescence quantification in lungs and bone for control (n = 2) or shANXA2 (n = 2) MDA-MB-231 cells after the second injection

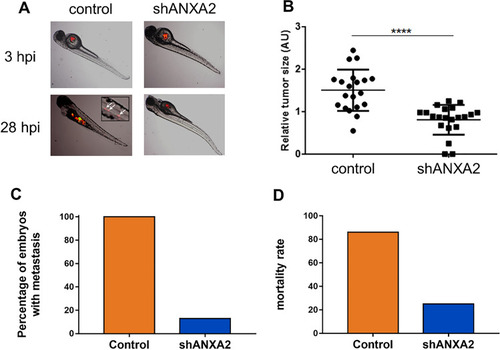
Genetic inhibition of ANXA2 prevents invasion and metastasis processes of MDA-MB-231 cells in zebrafish. A Control (n = 21) or shANXA2 MDA-MB-231 (n = 24) cells were injected in the perivitelline space of Casper zebrafish embryos. Tumor imaging was done by fluorescence microscopy at 3-, 28- and 52 hpi through the tdTomato fluorescent protein constitutively expressed in MDA-MB-231 cells. Inset displays magnified image of a portion of the tail with metastases (white arrows). B The relative tumor size within the perivitelline space has been measured in embryos either injected by control or shANXA2 cells. C The percentage of embryos, which presented caudal or head metastases was quantified at 28 hpi. D Mortality rate was calculated at 52 hpi

Acknowledgments
This image is the copyrighted work of the attributed author or publisher, and ZFIN has permission only to display this image to its users. Additional permissions should be obtained from the applicable author or publisher of the image. Full text @ Cell. Mol. Life Sci.