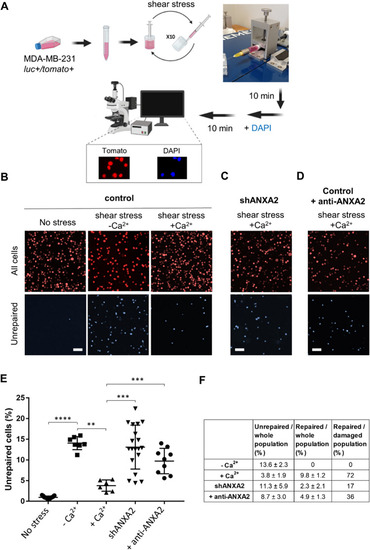
Response of control or shANXA2 MDA-MB-231 cells to membrane injury by shear-stress treatment. A Scheme of the protocol with a photography of the device used for the automatized shear-stress treatment. Cells were loaded in a 1 mL syringe with a 30G needle mounted on a fully automated syringe pump system. After 10 passages through the needle, cells were incubated with DAPI, which stained damaged/unrepaired cells, while all cells expressed the fluorescent protein tdTomato. Created using Biorender.com. B Representative images of control unstressed MDA-MB-231 (left-hand panels), and stressed cells in the absence (middle panels) or presence (right-hand panels) of 2 mM Ca2+. Scale bars: 50 µm. C Representative images of shANXA2 MDA-MB-231 submitted to the shear stress assay in the presence of 2 mM Ca2+. Scale bar: 50 µm. D Representative images of control MDA-MB-231 submitted to shear stress assay in the presence of 2 mM Ca2+ and monoclonal anti-ANXA2 antibody (1:50, Sigma-Aldrich). Scale bar: 50 µm. E DAPI-positive unrepaired cells over the whole cell population (tdTomato-positive), were quantified for at least 6 independent experiments. Experimental data together with mean (± SEM) are presented. Nonparametric Mann − Whitney test. **P value (< 0.01), ***P value (< 0.001), ****P value (< 0.0001). F Mean percentage of unrepaired cells represented in E are indicated in the second column. Mean percentage of “repaired cells over the whole cell population” (column 3) is calculated by subtracting the “unrepaired / whole cell population” rate to 13.6%, which corresponds to the rate of damaged and unrepaired cells in the absence of Ca2+ that prevents membrane resealing. “Repaired / damaged population” rate (column 4) is calculated as the percentage of repaired cells considering that the number of damaged cells is 13.6
|
