FIGURE SUMMARY
Title

Survival in macrophages induces enhanced virulence in Cryptococcus

Authors
Nielson, J.A., Jezewski, A.J., Wellington, M., Davis, J.M.
Source
Full text @ mSphere

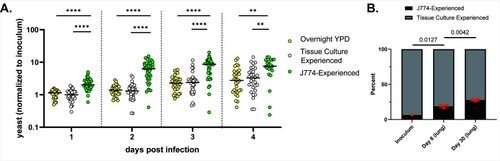
MECs show enhanced virulence in zebrafish larvae and mouse lungs. (A) Larvae inoculated with 20–70 fluorescent yeast prepared in one of three ways. Counts were performed by eye via live microscopy at 2 hpi and 1 through 4 days post-infection (dpi). Live counting allows for the assessment of yeast in expected and unexpected locations and focal planes. Charted are daily yeast counts normalized to counts at 2 hpi. Statistical comparisons represent the results of Mann-Whitney tests of log-transformed ratios. (B) Comparative fungal burden of TC-experienced (gray) and J774-experienced Cn in the lungs of mice infected intranasally with 1 × 10⁴ total CFU. Statistical comparisons represent unpaired t-tests of log-transformed ratios.

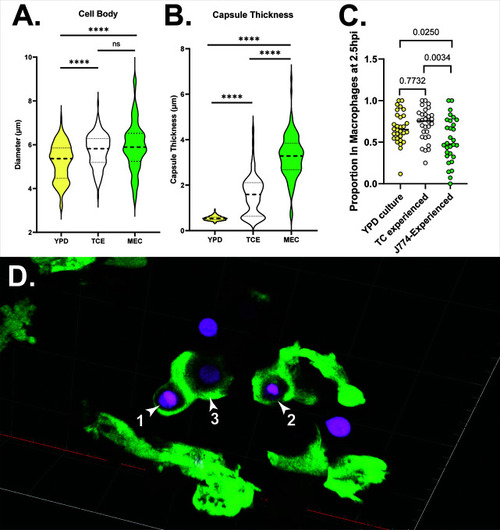
Tissue culture conditions and macrophage exposure induce increased cell body size and capsule production, with differing effects on phagocytosis. (A) Cell body diameters for YPD-grown, TC-experienced, and J774-experienced (MEC) Cn. Diameters measured via widefield microscopy. Data from three biological replicates of at least 20 cells per condition per replicate. Statistical comparisons represent the results of two-tailed unpaired t-tests. (B) Capsule diameters for the same cells analyzed in panel A. Statistical comparisons represent results of two-tailed unpaired t-tests. (C) The proportion of fluorescent yeast cells inside EGFP+ cells (macrophages) at 2.5 hpi. Statistical comparisons represent results of one-way ANOVA with multiple comparisons. (D) EGFP+ cells (mpeg+ macrophages) phagocytosing J774-experienced Cn at ~2.5 hpi. Yeast 1 and 2 are fully engulfed, while #3 is partially engulfed. Live confocal image taken with 40×, 1.1NA water objective. 3D rendering shown. Grid lines are 20 µm apart. Animation of this data in Video S1.

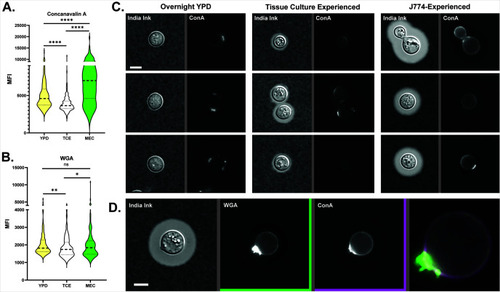
Yeast were incubated overnight in the indicated conditions, then isolated and fixed for microscopy at 63×/1.4NA. MECs have increased exposure to mannose and chitin despite the production of a thick capsule. Concanavalin (A) and wheat germ agglutinin (B) mean fluorescence intensities for Cn cultured in YPD, TC-experienced, or J774-experienced. Statistical comparisons represent the results of two-tailed, unpaired t-tests. (C) India ink and fluorescence images of YPD-cultured, TC-experienced, and J774-experienced Cn, three examples each. Staining in the first two conditions is punctate, at bud scars, or absent, while staining of J774-experienced cells is both punctate and circumferential. ConA is tagged with Alexa Fluor 633 (Fisher #C21402). Widefield images were taken with a 20×, 0.85NA objective. Exposures and intensity adjustments are uniform for all panels. (D) Example of ConA and WGA staining that overlaps on a different J774-experienced cell. Note intense staining at the bud scar with overlapping circumferential staining. WGA is tagged with Alexa Fluor 555 (Fisher #W32464). Widefield images were taken with a 20×, 0.85NA objective.

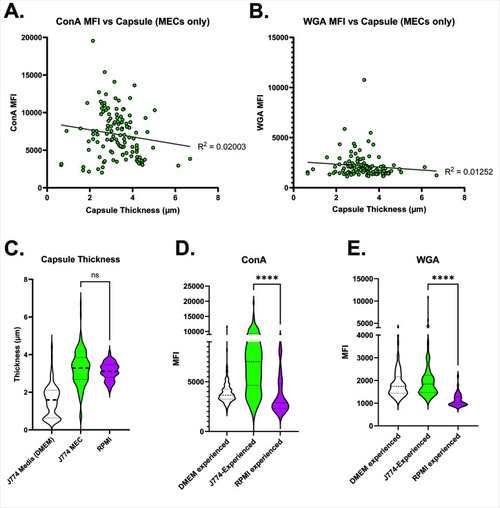
Yeast were incubated overnight in the indicated conditions, then isolated and fixed for staining and subsequent microscopy. Exposure of ConA and WGA on macrophage-experienced Cn. ConA (A) or WGA (B) mean fluorescence intensity (y-axis) plotted versus capsule thickness (x-axis) in J774-experienced Cn. We find no linear correlation between PAMP exposure and capsule thickness, demonstrating that the capsule itself is not a proxy for the degree of masking. R2 plotted via simple linear regression. C–E. Capsule thickness (C) is similar in J774-experienced Cn and Cn with capsule induced with RPMI but exposure of ConA (D) and WGA (E) is less. J774 media and MEC data are the same as in Fig. 2B, re-displayed in this context for clarity. Statistical comparisons represent the results of two-tailed unpaired t-tests.

J774-experienced Cn are more effective than YPD grown at colonizing the CNS in zebrafish but the difference is mostly accounted for by tissue culture conditions. (A) Yeast (green) outside the CNS vasculature (magenta) at 1 and 2 dpi after infection with YPD-grown Cn (left), TC-experienced Cn (middle) and J774-experienced Cn (right). Growth is subjectively greater in TC-experienced and J774-experienced Cn. Airyscan confocal images were collected with 40×, 1.1NA water objective. (B) Comparison of brain lesions per fish between historical data with YPD-grown Cn (ref), TC-experienced, and J774-experienced Cn. There is a strong trend toward fewer brain lesions per fish with YPD-grown Cn but this does not reach statistical significance with the data available. Statistical comparison for this and all other panels of this figure represents results of Mann-Whitney tests of log-transformed ratios. (C) Percent of brain lesions cleared between 1 and 3 dpi, between TC-experienced and J774-experienced Cn. The trend is toward more clearance of TC-experienced cells, but not statistically significant. (D and E) Fold change of number of yeast per brain lesion in lesions not cleared from 1 to 2 dpi (D) and 2 to 3 dpi (E).

Acknowledgments
This image is the copyrighted work of the attributed author or publisher, and ZFIN has permission only to display this image to its users. Additional permissions should be obtained from the applicable author or publisher of the image. Full text @ mSphere