IMAGE

Fig 4

ID
ZDB-IMAGE-240202-12
Source
Figures for Nielson et al., 2023
Image
Figure Caption

Fig 4

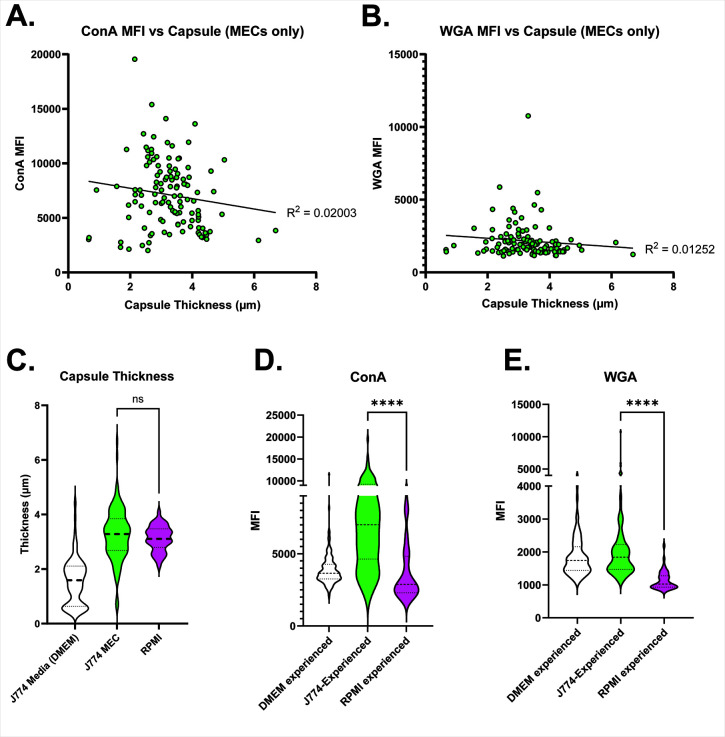
Yeast were incubated overnight in the indicated conditions, then isolated and fixed for staining and subsequent microscopy. Exposure of ConA and WGA on macrophage-experienced Cn. ConA (A) or WGA (B) mean fluorescence intensity (y-axis) plotted versus capsule thickness (x-axis) in J774-experienced Cn. We find no linear correlation between PAMP exposure and capsule thickness, demonstrating that the capsule itself is not a proxy for the degree of masking. R2 plotted via simple linear regression. C–E. Capsule thickness (C) is similar in J774-experienced Cn and Cn with capsule induced with RPMI but exposure of ConA (D) and WGA (E) is less. J774 media and MEC data are the same as in Fig. 2B, re-displayed in this context for clarity. Statistical comparisons represent the results of two-tailed unpaired t-tests.

Acknowledgments
This image is the copyrighted work of the attributed author or publisher, and ZFIN has permission only to display this image to its users. Additional permissions should be obtained from the applicable author or publisher of the image. Full text @ mSphere