
- Title
-
The male and female genomes of golden pompano (Trachinotus ovatus) provide insights into the sex chromosome evolution and rapid growth
- Authors
- Luo, H., Zhang, Y., Liu, F., Zhao, Y., Peng, J., Xu, Y., Chen, X., Huang, Y., Ji, C., Liu, Q., He, P., Feng, P., Yang, C., Wei, P., Ma, Z., Qin, J., Zhou, S., Dai, S., Zhang, Y., Zhao, Z., Liu, H., Zheng, H., Zhang, J., Lin, Y., Chen, X.
- Source
- Full text @ J Adv Res
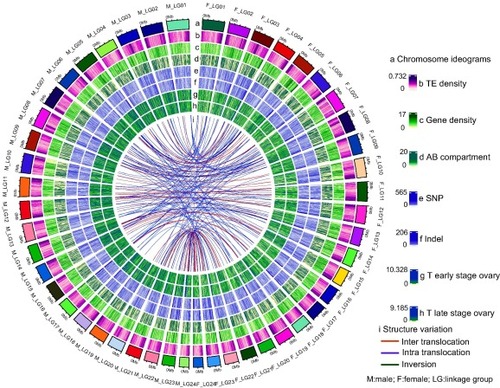
Overview of golden pompano female and male genomes. Numbers on the circumference are at the megabase scale. Genomic landscape between male and female genomes. a, Chromosome ideograms. b, TE density in 100 kb sliding windows. c, Gene density in 100 kb sliding windows. d, AB compartment. e, SNP variations between male and female genomes in 100 kb sliding windows. f, Indel variations between male and female genomes in 100 kb sliding windows. g, Transcriptome of the early-stage ovary. h, Transcriptome of the late-stage ovary. i, Structure variation. |
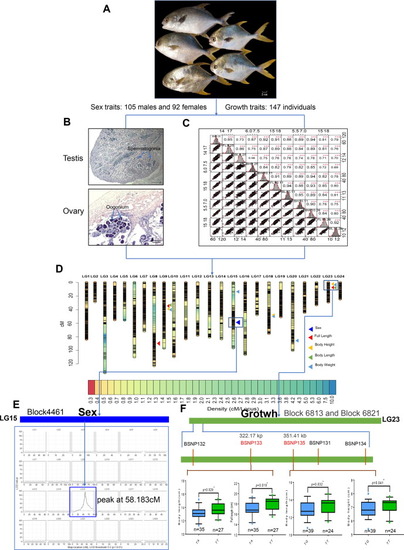
Primary QTL mapping for sex- and growth-related traits of golden pompano. A. The appearance of representative F1 individuals. Scale bars, 2 cm (down right corner). B. Sex identification of golden pomoano by H.E staining of gonad slices. Picture is represent for testis (105 individuals) or ovary (92 individuals) H.E staining. Tipical spermatogonia from male testis and oogonium for female ovary are shown in the slices. C.The variation and Pearson pairwise correlation analyses of body weight (BW), Full length (FL), body length (BL) and body height (BH) of the F1 population. The four traits were independently investigated three times. The correlations were calculated using Spearman correlation coefficients, and the p values are indicated as the following: *p<0.05, **p<0.01, ***p<0.001. The analysis was performed using the R package PerformanceAnalytics. Frequency distribution histograms for the four traits are displayed along the diagonal (top right corner). D. The high-density genetic map is based on 4103 bin markers and repeatable QTLs responsible for Sex, BW, FL, BL and BH. The graduated color indicates the marker density on the linkage groups. The triangle of different colors represents different QTLs for corresponding traits. E. Sex-related QTL mapping showing the highest logarithm of odds (LOD) value peak at 58.183 cM in Block4461 based on 4103 bin markers. F. Growth-related mapping showing only BSNP133 and BSNP135, located in Block 6813 and Block 6821, respectively, in linkage group 23 were significantly correlated with body length. KASP-based (Kompetitive Allele-Specific PCR) SNP confirmation for QTLs on linkage group (LG) 23. Five evenly distributed SNPs were developed among the cluster QTL region on LG23 and 64 additional F1 individuals were genotyped by KASP Assays. The F1 individuals were grouped according to their genotypes (TA&TT, TG&TT), and box charts displayed the results. The significance testing was conducted by Wilcox Test. *p<0.05, **p<0.01, ***p<0.001. |
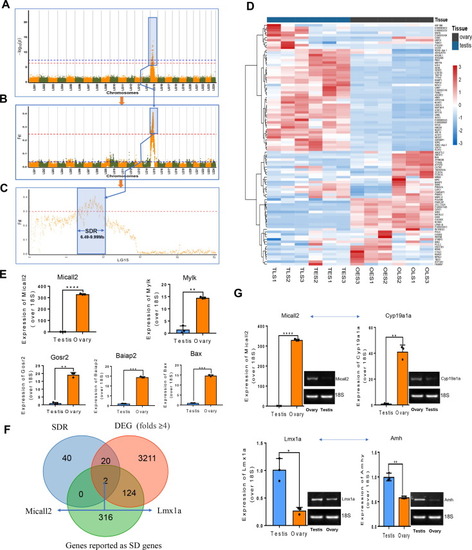
Identification of sex determination pattern and sex-determining region (SDR). A. P values (log10 transformed) of genome-wide association study (GWAS) for the sex trait (male or female). Red dotted line represents GWAS threshold (p < 5.4e-07), blue one is a suggestive (p < 5.4e-08) threshold. B. FST values between female and male for 100 kb overlapping windows at 5 kb steps in LG15. C. The zoom-in view of blue region in B on the LG15. The sex-specific region was enriched in a ∼ 3.5 Mb region from 6.49 to 9.99 Mb. D. Heatmap of the differentially expressed genes between ovary and testis located in the SDR. OLS, OES, TES, and TLS represent the ovary late stage, ovary early stage, testis early stage, and testis late stage, respectively. E. QPCR results of five randomly picked genes from the SDR. The data represent as mean ± sem. *p < 0.05, **p < 0.01, ***p < 0.001 represents statistically significant. F. A Venn diagram showing two genes, Micall2 and Lmx1a, are shared by the SDR, diffrentially expressed genes (change folds more than 4) in gonads. G. QPCR and electrophoresis detections of Micall2 and Lmx1a, as well as Cyp19a1a and Amhy in ovary and testis. Cyp19a1a was used as a marker for sex determination in female fish, while Amhy as a marker for males. 18S RNA was used as a reference. (For interpretation of the references to color in this figure legend, the reader is referred to the web version of this article.) |
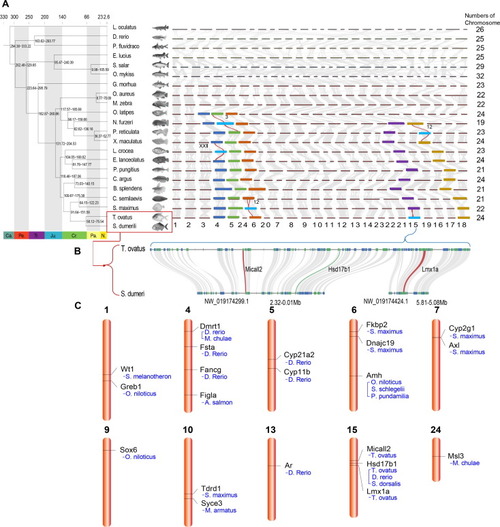
Sex determining region (SDR) analysis in radial fins fish. A. The genomic synteny among the twenty-two fishes. Phylogenetic relationship of golden pompano and relevant twenty-one teleost lineages, and chromosome evolutions of the twenty-two teleosts. Divergence ages are shown on the joinpoints of the tree. The divergence age was estimated using the nodes with calibration times derived from the Time Tree database. Ages do not represent the exact point estimates. Chromosome evolutions were analyzed according to the multicollinearity among chromosomes of lineages. The chromosome number of golden pompano was shown. The bright blue boxes with labeled chromosome numbers represent the known SDRs in other lineages. The dark blue, green, brown, purple and yellow box means the clinearity of other fishes with corresponding to known SDR-linked Chromosome XXII, 3, 12, 15, and 12. B. Micro-colinearity between golden pompano and the S. dumeri at SDR. Scaffolds (NW_019174299.1 and NW_019174424.1) were homologues with the SDR of golden pompano. C. Genomic locations of the golden pompano SDR genes and SDR-homologous genes in golden pompano. SDR genes previously reported in other fishes (see species name in the picture) were used for localized the homologous genes in golden pompano. (For interpretation of the references to color in this figure legend, the reader is referred to the web version of this article.) |
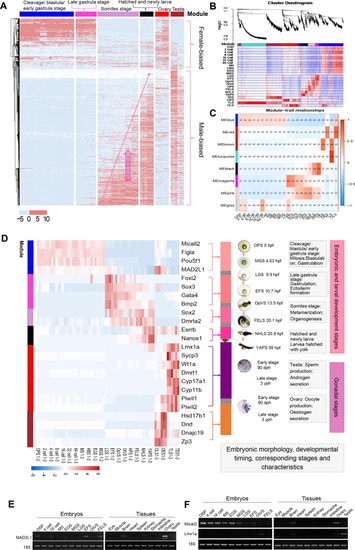
Sex-biased gene expression throughout development. A. Heatmap of the sex-related genes in 19 embryonic developmental stages were clustered based on the FPKM value. B. Heatmap of the gene co-expression network. Clustering dendrograms of all sex-related genes, with dissimilarity based on the topological overlap and assigned module colors. Seven modules were clustered and displayed in different colors. C. Module-trait associations. Each column corresponds to a development stage, and each row corresponds to a module. The number in the rectangle is the correlation coefficient, and the number in brackets is the corresponding p value. D. Heatmap of the selected 24 sex-related stage-specific genes filtered by previously documented and the KME value > 0.7. In each module, the corresponding development stage and time were listed in the right part. E F. PCR validation of MAD2L1 (E), Micall2 and Lmx1a (F) in embryos and organs of golden pompano. 18S RNA was used as a reference. OSP, oosperm; MS, morula stage; EGS, early gastrula stage; MGS, middle gastrula stage; LGS, late gastrula stage; EFS, embryo formed stage; OTVS, otocyst vesicle stage; FELS, formation of the eye lens. |
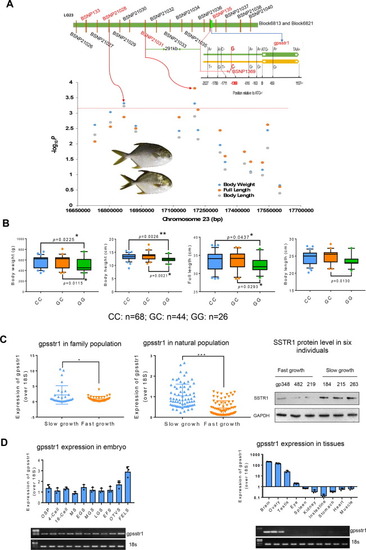
QTL fine mapping and identification of gene closely associated growth. A. Fine mapping of candidate gene gpsstr1. According to the confirmed SNPs (BSNP132, BSNP135), underlying bin markers of Block6813 and Block6821, a total of 14 SNPs were developed to genotype a panel of 146 natural-collected individuals by KASP Assays. Manhattan plot of haplotype-based regional association analysis was displayed. The red dotted line represents the significance threshold (P = 0.01/14) (bottom left corner). The SNP (-1369) in the promoter region of gpsstr1 was verified by Sanger sequencing. B. The natural growing group were grouped according to their genotypes (CC, GC&GG). Two-tailed Student's t-test was used to calculate the P value between different groups (bottom right corner). For all the box charts: minimum value = lower whisker, maximum value = upper whisker, median = middle value of the box, lower quartile = median of the lower half of dataset, upper quartile = median of the upper half of dataset, datapoint outside of whiskers = potential outlier. C. Expression of gpsstr1 in 64 family population individuals (left) and 146 natural population individuals (middle) of golden pompano, respectively, using qPCR method. According to their growth trait data, golden pompano fishes were classified into slow and fast-growth groups. The protein levels of SSTR1 in three fast-growth (numbered gp238, gp482 and gp219) and three slow-growth individuals (numbered gp184, gp215 and gp263) were measured by Western blotting method. Band intensity represents protein level. The data represent as mean ± sem. *p < 0.05, **p < 0.01, ***p < 0.001 represents statistically significant. D. Expression profiles of gpsstr1 in 10 embryo stages and 10 tissues of golden pompano by using qPCR (up) and reverse transcription PCR (electrophoretic bands, down). 18S RNA was used as a reference. (For interpretation of the references to color in this figure legend, the reader is referred to the web version of this article.) |
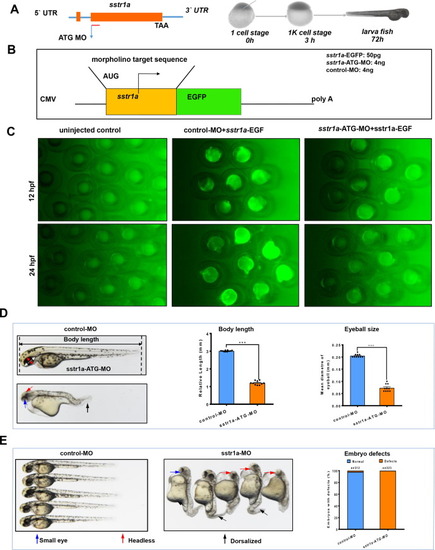
Loss of sstr1a causes embryo defects in zebrafish. A. Schematic map of sstr1a gene and the MO design and micro-injection strategy. B. Site-specific effect of sstr1a-MO injected into zebrafish. Box shows schematic diagrams of sstr1a-EGFP fluorescent reporter mRNAs, the upper one containing the sstr1a-ATG-MO target sequence (yellow box) fused in-frame with EGFP. 50 pg sstr1a-EGFP injected with a standard control morpholino (4 ng) or sstr1a-ATG-MO (4 ng). C. Embryos were photographed at 12 and 24-hpf. Embryos injected with sstr1a-GFP plasmid DNA under the driving of CMV promoter showed green fluorescence. When co-injected with sstr1a-ATG-MO, green fluorescence decreased dramatically. hpf, hours post fertilization. D. Loss of sstr1a impacts the growth of zebrafish. Body length and eyeball size were measured at 2-dpf. E. Gross morphology at 2-dpf. Compared with control MO, knock down sstr1a present small eyes (blue arrow), tail patterning defects (dorsalized, black arrow), headless (red arrow) and pericardial oedema (purple arrow). The numbers of embryo defects were counted. Error bars, mean ± s.e.m.; ***p < 0.0001 (n = 10; Student’s t test). dpf, days post fertilization. (For interpretation of the references to color in this figure legend, the reader is referred to the web version of this article.) |