
|
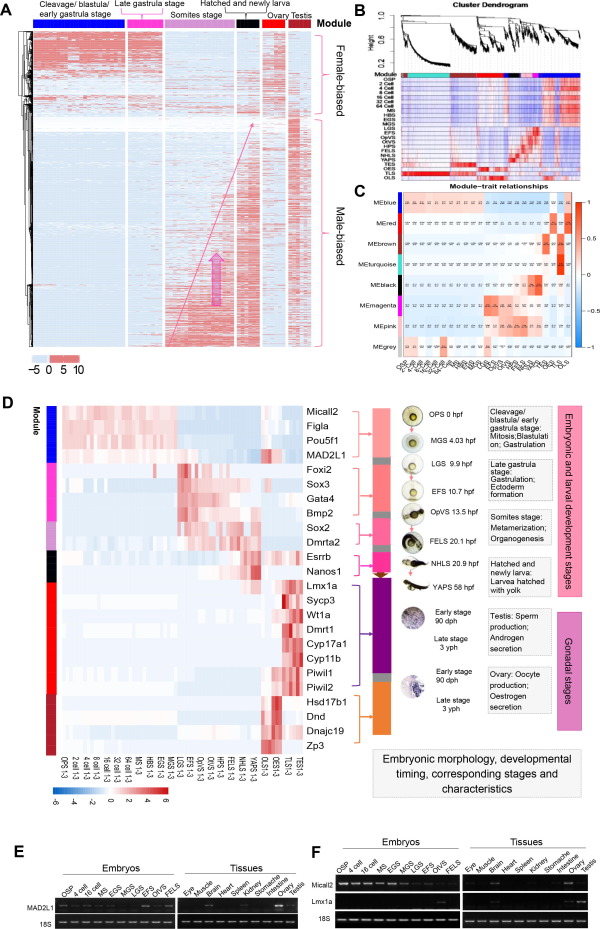
Fig. 5 Sex-biased gene expression throughout development. A. Heatmap of the sex-related genes in 19 embryonic developmental stages were clustered based on the FPKM value. B. Heatmap of the gene co-expression network. Clustering dendrograms of all sex-related genes, with dissimilarity based on the topological overlap and assigned module colors. Seven modules were clustered and displayed in different colors. C. Module-trait associations. Each column corresponds to a development stage, and each row corresponds to a module. The number in the rectangle is the correlation coefficient, and the number in brackets is the corresponding p value. D. Heatmap of the selected 24 sex-related stage-specific genes filtered by previously documented and the KME value > 0.7. In each module, the corresponding development stage and time were listed in the right part. E F. PCR validation of MAD2L1 (E), Micall2 and Lmx1a (F) in embryos and organs of golden pompano. 18S RNA was used as a reference. OSP, oosperm; MS, morula stage; EGS, early gastrula stage; MGS, middle gastrula stage; LGS, late gastrula stage; EFS, embryo formed stage; OTVS, otocyst vesicle stage; FELS, formation of the eye lens.