
Fig. 2
- ID
- ZDB-FIG-241028-36
- Publication
- Luo et al., 2023 - The male and female genomes of golden pompano (Trachinotus ovatus) provide insights into the sex chromosome evolution and rapid growth
- Other Figures
- All Figure Page
- Back to All Figure Page
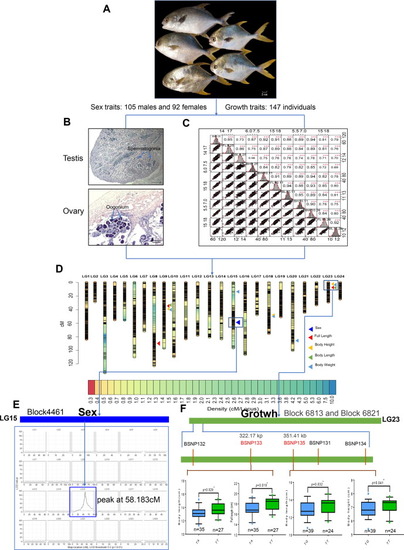
Primary QTL mapping for sex- and growth-related traits of golden pompano. A. The appearance of representative F1 individuals. Scale bars, 2 cm (down right corner). B. Sex identification of golden pomoano by H.E staining of gonad slices. Picture is represent for testis (105 individuals) or ovary (92 individuals) H.E staining. Tipical spermatogonia from male testis and oogonium for female ovary are shown in the slices. C.The variation and Pearson pairwise correlation analyses of body weight (BW), Full length (FL), body length (BL) and body height (BH) of the F1 population. The four traits were independently investigated three times. The correlations were calculated using Spearman correlation coefficients, and the p values are indicated as the following: *p<0.05, **p<0.01, ***p<0.001. The analysis was performed using the R package PerformanceAnalytics. Frequency distribution histograms for the four traits are displayed along the diagonal (top right corner). D. The high-density genetic map is based on 4103 bin markers and repeatable QTLs responsible for Sex, BW, FL, BL and BH. The graduated color indicates the marker density on the linkage groups. The triangle of different colors represents different QTLs for corresponding traits. E. Sex-related QTL mapping showing the highest logarithm of odds (LOD) value peak at 58.183 cM in Block4461 based on 4103 bin markers. F. Growth-related mapping showing only BSNP133 and BSNP135, located in Block 6813 and Block 6821, respectively, in linkage group 23 were significantly correlated with body length. KASP-based (Kompetitive Allele-Specific PCR) SNP confirmation for QTLs on linkage group (LG) 23. Five evenly distributed SNPs were developed among the cluster QTL region on LG23 and 64 additional F1 individuals were genotyped by KASP Assays. The F1 individuals were grouped according to their genotypes (TA&TT, TG&TT), and box charts displayed the results. The significance testing was conducted by Wilcox Test. *p<0.05, **p<0.01, ***p<0.001. |