
|
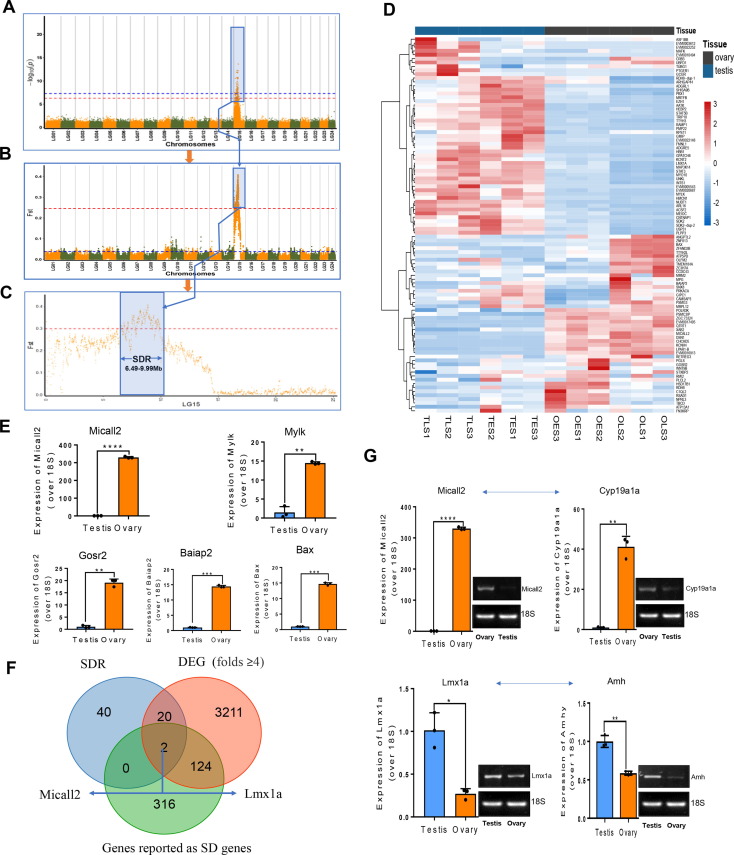
Fig. 3 Identification of sex determination pattern and sex-determining region (SDR). A. P values (log10 transformed) of genome-wide association study (GWAS) for the sex trait (male or female). Red dotted line represents GWAS threshold (p < 5.4e-07), blue one is a suggestive (p < 5.4e-08) threshold. B. FST values between female and male for 100 kb overlapping windows at 5 kb steps in LG15. C. The zoom-in view of blue region in B on the LG15. The sex-specific region was enriched in a ∼ 3.5 Mb region from 6.49 to 9.99 Mb. D. Heatmap of the differentially expressed genes between ovary and testis located in the SDR. OLS, OES, TES, and TLS represent the ovary late stage, ovary early stage, testis early stage, and testis late stage, respectively. E. QPCR results of five randomly picked genes from the SDR. The data represent as mean ± sem. *p < 0.05, **p < 0.01, ***p < 0.001 represents statistically significant. F. A Venn diagram showing two genes, Micall2 and Lmx1a, are shared by the SDR, diffrentially expressed genes (change folds more than 4) in gonads. G. QPCR and electrophoresis detections of Micall2 and Lmx1a, as well as Cyp19a1a and Amhy in ovary and testis. Cyp19a1a was used as a marker for sex determination in female fish, while Amhy as a marker for males. 18S RNA was used as a reference. (For interpretation of the references to color in this figure legend, the reader is referred to the web version of this article.)