FIGURE SUMMARY
Title

Molecular analyses of zebrafish V0v spinal interneurons and identification of transcriptional regulators downstream of Evx1 and Evx2 in these cells

Authors
England, S.J., Rusnock, A.K., Mujcic, A., Kowalchuk, A., de Jager, S., Hilinski, W.C., Juárez-Morales, J.L., Smith, M.E., Grieb, G., Banerjee, S., Lewis, K.E.
Source
Full text @ Neural Dev.

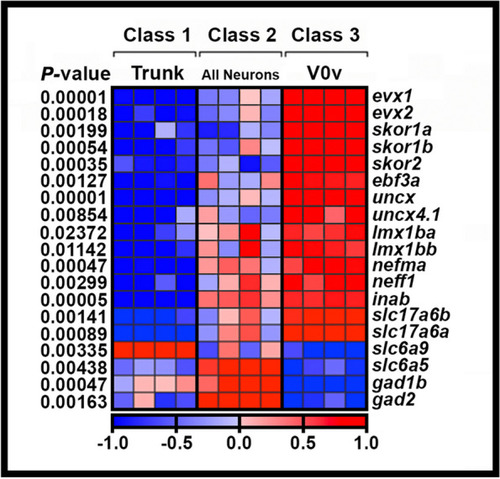
Transcriptional profiling of V0v spinal interneurons. Heatmap analysis of gene-expression profiling of 27 h V0v spinal cord interneurons. A three-class ANOVA analysis of differential expression was performed on different FAC-sorted populations of cells. Class 1: All trunk cells. Class 2: All post-mitotic spinal neurons. Class 3: V0v interneurons. Each column is a different biological replicate. Rows show relative expression levels for a single gene as normalized data transformed to a mean of 0, with standard deviation of + 1 (highly expressed, red) or -1 (weakly/not expressed, blue) sigma units. Adjusted P-values corrected for multiple testing are shown on the left-hand side. Expression profiles for positive control genes evx1 and evx2, whose spinal cord expression is exclusive to V0v interneurons, are shown. The high level of expression of these genes in our V0v samples, compared to the other samples, confirms that we have successfully isolated V0v interneurons. Additional positive control genes slc17a6a and slc17a6b, confirm that V0v interneurons are excitatory (glutamatergic), whereas negative control genes slc6a9, slc6a5, gad1b and gad2 show that V0v interneurons do not express either glycinergic or GABAergic inhibitory neurotransmitter pathway genes and that there is no contamination of our V0v samples with inhibitory neurons. The expression profiles for slc17a6a, slc17a6b, slc6a9, slc6a5, gad1b and gad2 are reproduced from [14] as per the Creative Commons Attribution (CC BY) license at Neural Development

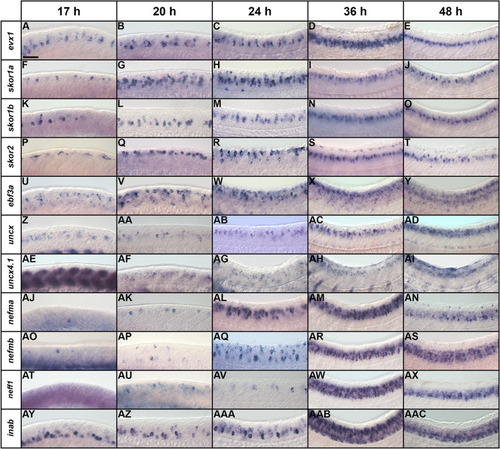
Temporal expression profiles of V0v candidate genes in zebrafish spinal cord. (A-AAC) Lateral views of (A-E) evx1, (F-J) skor1a, (KO) skor1b, (PT) skor2, (U-Y) ebf3a, (Z-AD) uncx, (AE-AI) uncx4.1, (AJ-AN) nefma, (AO-AS) nefmb, (AT-AX) neff1, and (AY-AAC) inab expression in WT spinal cord at (A, F, K, P, U, Z, AE, AJ, AO, AT, AY) 17 h, (B, G, L, Q, V, AA, AF, AK, AP, AU, AZ) 20 h, (C, H, M, R, W, AB, AG, AL, AQ, AV, AAA) 24 h, (D, I, N, S, X, AC, AH, AM, AR, AW, AAB) 36 h, and (E, J, O, T, Y, AD, AI, AN, AS, AX, AAC) 48 h. Rostral, left. Dorsal, up. (A-E) evx1 is exclusively expressed in V0v spinal interneurons at all developmental stages analyzed and is shown here as a reference. Scale bar: 50 µm

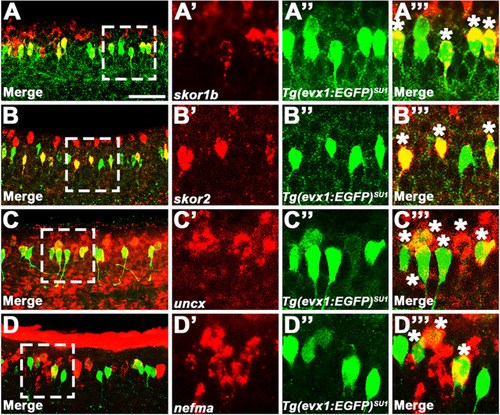
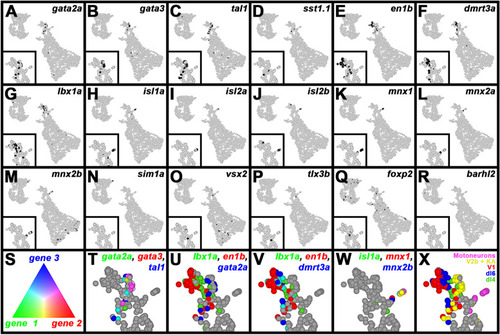
V0v candidate genes are co-expressed in subsets of V0v spinal interneurons. (
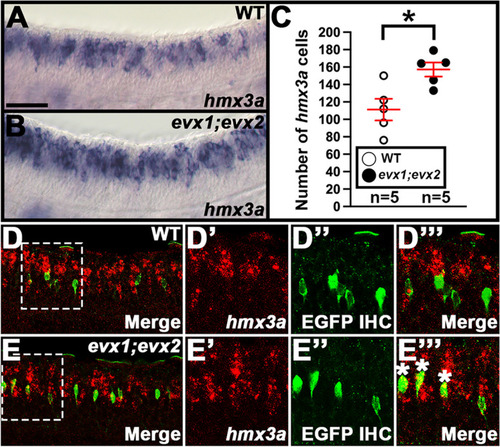
A-D’’’) Lateral views of WT spinal cord at 27 h. Rostral, left. Dorsal, up. in situ hybridization for (A’) skor1b, (B’), skor2, (C’), uncx, and (D’) nefma genes is shown in red. (A’’, B’’, C’’, D’’) Immunohistochemistry for Tg(evx1:EGFP)SU1, which exclusively labels V0v spinal interneurons, is shown in green. (A, A’’’, B, B’’’, C, C’’’, D, D’’’) Merged images. (A, B, C, D) Maximum intensity projection images. (A’-A’’’, B’-B’’’, C’-C’’’, D’-D’’’) High-magnification single confocal planes of the region indicated by white dotted boxes in A, B, C and D. Similar skor2 results were also reported in [14]. We are showing additional skor2 data here to demonstrate reproducibility of our co-expression experiments, and for ease of comparison with the skor1b, uncx and nefma data. White asterisks indicate double-labelled V0v interneurons. Cells that are green and not red could be V0v interneurons that do not express the gene in question, or V0v interneurons with low expression, not revealed in these experiments, of the gene detected in red. We often detect fewer cells expressing a particular gene in double-labelling experiments where the mRNA is detected with a red fluorophore, than in single in situ hybridization experiments where the mRNA is detected with NBT/BCIP (viewed as an opaque blue stain under visible light), suggesting that the weakest-expressing cells may not be detected in the former, probably due to the prolonged processing of samples necessitated by fluorescent double-labelling experiments, which can affect the stability of target mRNA molecules, and the lower sensitivity of the red label. Therefore, we cannot conclude for certain that single-labelled EGFP-positive cells, do not express the gene detected in red. Scale bar: (A, B, C, D) 50 µm, (A’-A’’’, B’-B’’’, C’-C’’’, D’-D’’’) 20 µm

Expression of skor1a, skor1b, skor2, ebf3a, uncx and uncx4.1 in Zebrafish evx1;evx2 double mutant and WT embryos. (A, B, D, E, G, H, J, K, M, N, P, Q) Lateral views of (A, D, G, J, M, P) WT and (B, E, H, K, N, Q) evx1i232;i232;evx2sa140;sa140 double mutant embryos (labeled evx1;evx2) at 30 h. Rostral, left. Dorsal, up. (C, F, I, L, O) Number of cells expressing (C) skor1a, (F) skor1b, (I) skor2, (L) ebf3a, and (O) uncx in a precisely-defined spinal cord region adjacent to somites 6–10 at 30 h. We could not reliably count the number of cells expressing uncx4.1, due to the weak, punctate nature of the expression. Data are depicted as individual value plots with the n-values shown below. For each plot, the wider red horizontal bar indicates the mean number of cells, and the red vertical bar depicts the S.E.M. (both values are also listed in Table 1). All counts are an average of at least three embryos. Statistically significant comparisons are indicated with brackets and asterisks. *** P < 0.001. * P < 0.05. White circles indicate WT data and black circles indicate evx1;evx2 double mutant data. All data were analyzed for normality using the Shapiro–Wilk test. Data in L is not normally distributed and so a Wilcoxon-Mann–Whitney test was performed. Data sets in C, F, I and O are normally distributed and so the F-test for equal variances was performed, followed by a type 2 Student’s t-test (for equal variances). P-values are provided in Table 1. (C, F, I, L, O) There is a statistically significant reduction in the number of spinal interneurons expressing skor1a, skor1b, skor2 and ebf3a, but not uncx, in evx1;evx2 double mutant embryos. (A, B) skor1a, (D, E) skor1b and (P, Q) uncx4.1 in situ hybridization experiments were performed with the molecular crowding reagent Dextran Sulfate. This was omitted for the (G, H) skor2, (J, K), ebf3a and (M, N) uncx in situ hybridization experiments. Scale bar: 50 µm

Expression of nefma, nefmb, neff1 and inab in zebrafish evx1;evx2 double mutant and WT embryos. (A, B, D, E, G, H, J, K) Lateral views of (A, D, G, J) WT and (B, E, H, K) evx1i232;i232;evx2sa140;sa140 double mutant embryos (labeled evx1;evx2) at 30 h. Rostral, left. Dorsal, up. (C, F, I, L) Number of cells expressing (C) nefma, (F) nefmb, (I) neff1 and (L) inab in a precisely-defined spinal cord region adjacent to somites 6–10 at 30 h. Data are depicted as individual value plots and the n-values for each genotype are shown below. For each plot, the wider red horizontal bar depicts the mean number of cells, and the red vertical bar depicts the S.E.M. (mean numbers and S.E.M. values are listed in Table 1). All counts are an average of at least four embryos. Statistically significant comparisons are indicated with brackets and asterisks. *** P < 0.001. * P < 0.05. White circles indicate WT data and black circles indicate evx1;evx2 double mutant data. All data were analyzed for normality using the Shapiro–Wilk test. Data in C is not normally distributed and so a Wilcoxon-Mann–Whitney test was performed. Data sets in F, I and L are normally distributed and so the F-test for equal variances was performed, followed by a type 2 Student’s t-test (for equal variances). P-values are provided in Table 1. (C, I) There is a statistically significant reduction in the number of spinal interneurons expressing nefma and neff1, but not (F, L) nefmb and inab, in evx1;evx2 double mutant embryos. (A, B) nefma and (G, H) neff1 in situ hybridization experiments were performed with the molecular crowding reagent Dextran Sulfate. This was omitted for the (D, E) nefmb and (J, K) inab in situ hybridization experiments. Scale bar: 50 µm

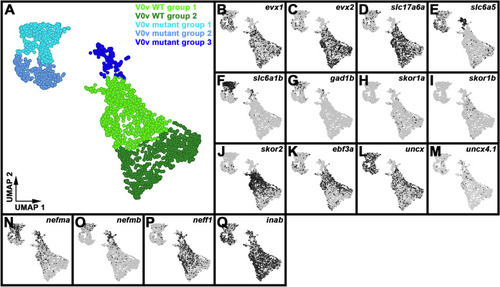
Single-cell RNA-seq analysis of WT and evx1/2 mutant V0v interneurons identifies five distinct clusters of cells. (A) 2D UMAP plot of 48 h post-mitotic V0v spinal interneuron single-cell RNA-seq atlas (2860 cells). Cells were obtained from 48 h embryos produced from an incross of evx1i232/+;evx2sa140/+ heterozygous parents homozygous for Tg(evx1:EGFP)SU2. Clusters are color-coded by cell identity: V0v WT Group 1 (light green), V0v WT Group 2 (dark green), V0v Mutant Group 1 (turquoise), V0v Mutant Group 2 (light blue), and V0v Mutant Group 3 (dark blue). Cell fate assignments were deduced and extrapolated by comparing expression profiles of 48 h single-cell clusters with the molecular phenotypes of V0v spinal interneurons in WT and evx1 and evx2 single and double mutant embryos [14]. (B-Q) 2D UMAP plots of differential gene expression between cell clusters. Black shows high levels of expression, light grey shows low levels of expression. All expression data have been normalized (see Methods). (B-D) Many of the cells in both WT clusters express (B) evx1 and/or (C) evx2, as well as the glutamatergic marker (D) slc17a6a. (B-G) evx1, evx2 and slc17a6a are all detected in fewer cells in Mutant Groups 1 and 2 and hardly any cells in Mutant Group 3. Many cells in the mutant clusters upregulate inhibitory markers, including (E) slc6a5, (F) slc6a1b, and (G) gad1b. (H) skor1a and (I) skor1b are not detected in many cells in this data set. (H) skor1a is expressed in a few WT Group 1 and 2 cells, as well as a couple of Mutant Group 3 cells and a Mutant Group 1 cell. (I) skor1b is predominantly detected in a few WT Group 1 cells. (J) In contrast, skor2 is expressed at high levels in most V0v WT Group 1 cells, and it is also detected in multiple WT Group 2 cells and a small number of Mutant Group 2 cells. (K) ebf3a has a similar expression profile to skor2, except that its expression is also detected in a few Mutant Group 1 cells and slightly more Mutant Group 2 cells. (L) uncx is expressed by many cells in all the clusters except the Mutant Group 3 cluster. The highest proportions of uncx-expressing cells are in Mutant Groups 1 and 2 (56.58% (245/433) and 58.81% (217/369) respectively, compared to 42.44% (396/933) WT Group 1 cells, 32.79% (303/924) WT Group 2 cells, and 12.44% (25/201) Mutant Group 3 cells). (M) In contrast to uncx, uncx4.1 is only expressed by several cells in each of the clusters. (N-Q) Of the neuronal intermediate filament genes, inab is expressed in all five clusters, but it is detected in slightly fewer cells in the mutant clusters. (NO) nefma and nefmb are predominantly expressed by cells in WT and Mutant Group 1 clusters and the Mutant Group 3 cluster. (P) neff1 is detected in most WT Group 1 cells, some WT Group 2 cells, several Mutant Group 3 cells, but hardly any Mutant Group 1 or 2 cells

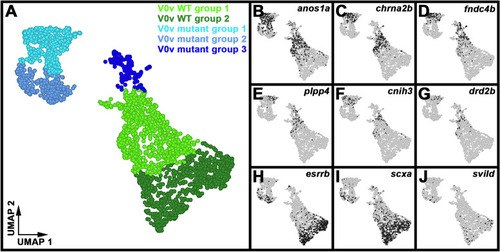
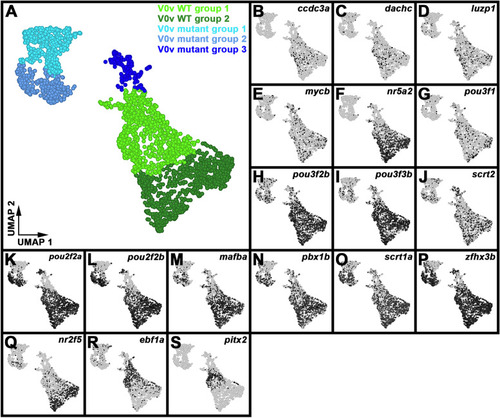
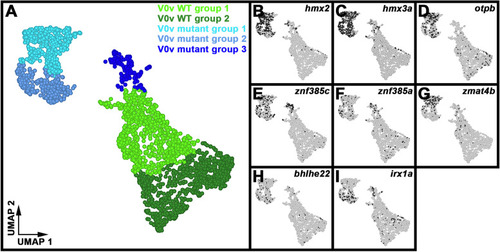
Differential gene expression identifies two distinct subsets of WT V0v spinal interneurons. (A) 2D UMAP plot of 48 h post-mitotic V0v spinal interneuron single-cell RNA-seq atlas (2860 cells). Cells were obtained from 48 h embryos produced from an incross of evx1i232/+;evx2sa140/+ heterozygous parents homozygous for Tg(evx1:EGFP)SU2. Clusters are color-coded by cell identity: V0v WT Group 1 (light green), V0v WT Group 2 (dark green), V0v Mutant Group 1 (turquoise), V0v Mutant Group 2 (light blue), and V0v Mutant Group 3 (dark blue). For ease of cell type comparison, panel 7A has been reproduced from Fig. 6A. (B-J) 2D UMAP plots of differential gene expression between cell clusters. Black shows high levels of expression, light grey shows low levels of expression. All expression data have been normalized (see Methods). (B) anos1a, (C) chrna2b, (D) fndc4b, (E) plpp4, (F) cnih3, and (G) drd2b are all expressed in more cells in WT and Mutant Group 1 clusters than WT and Mutant Group 2 clusters. In contrast, (H) esrrb, (I) scxa, and (J) svild are all expressed in more cells in WT and Mutant Group 2 clusters than WT and Mutant Group 1 clusters

evx1;evx2 Mutant Group 3 cells mis-express inhibitory spinal interneuron, or motoneuron genes. (A-R) 2D UMAP plots of differential gene expression between cell clusters in the 48 h post-mitotic V0v spinal interneuron single-cell RNA-seq atlas. For cell cluster identities, see Fig. 6A. Black shows high levels of expression, light grey shows low levels of expression. Inset panels in A-R show high-magnification views of Mutant Group 3 cells. For the number of cells expressing each gene see Table 3. (T-X) High magnification views of Mutant Group 3 cells showing three-way differential gene expression (T-W) or different cell fates (X). Panel (S) indicates the color-coding for panels (T-W). (T-W) Cells expressing only gene 1 are green. Cells expressing only gene 2 are red. Cells expressing only gene 3 are blue. Cells are yellow, pink, or turquoise if they co-express genes 1 and 2, genes 2 and 3, and genes 1 and 3 respectively. Cells expressing all three genes are white. All expression data have been normalized (see Methods). (A-G) Distinct subsets of Mutant Group 3 cells express markers of inhibitory spinal neurons, including (A) gata2a, (B) gata3, and (C) tal1 (usually expressed by KA’, KA’’ and V2b inhibitory interneurons), (D) sst1.1 (usually expressed by KA’ inhibitory interneurons), (E) en1b (usually expressed by V1 inhibitory interneurons), (F) dmrt3a (usually expressed by dI6 inhibitory interneurons), and (G) lbx1a (usually expressed by dI4 and dI6 inhibitory interneurons, although it is also expressed in dI5 excitatory interneurons). (H-M) A further subset of Mutant Group 3 cells co-express markers of acetylcholinergic motoneuron cells, including (H) isl1a, (I) isl2a, (J) isl2b, (K) mnx1, (L) mnx2a, and (M) mnx2b. (N-R) In contrast, Mutant Group 3 cells do not strongly express markers of other excitatory spinal neurons, such as (N) sim1a (usually expressed by V3 excitatory interneurons), (O) vsx2 (usually expressed by V2a excitatory interneurons), (P) tlx3b (usually expressed by dI3 and dI5 excitatory interneurons), (Q) foxp2 (usually expressed by dI2 excitatory interneurons, although it is also expressed in V1 inhibitory interneurons), and (R) barhl2 (usually expressed by dI1 excitatory interneurons). (T) KA’, KA’’ and V2b genes, gata2a, gata3 and tal1 are co-expressed in a distinct subset of Mutant Group 3 cells. (U-V) Adjacent and to the left of this KA/V2b-like subset are two distinct subsets of cells expressing lbx1a (green cells in U and V) and/or dmrt3a (blue and turquoise cells in V), or en1b (red cells in U-V), which are expressed by dI4 (lbx1a), dI6 (lbx1a + dmrt3a) and V1 (en1b) interneurons respectively. (W) Adjacent and to the right of the KA/V2b-like subset of Mutant Group 3 cells shown in T, is a subset of cells co-expressing the motoneuron genes isl1a, mnx1, and mnx2b. (X) Sub-clusters are color-coded by cell identity assigned based on the differential expression profiles shown in A-M and T-W: Motoneurons (pink), V2b + KA neurons (yellow), V1 neurons (red), dI6 neurons (blue), and dI4 neurons (green)

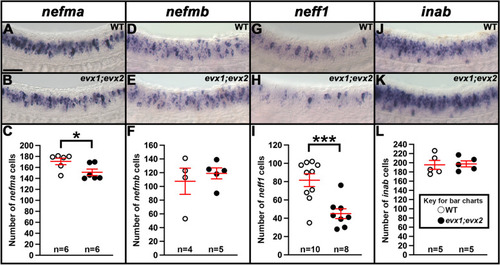
Genes downregulated in evx1;evx2 Mutant Group 1 and 2 V0v spinal interneurons. (A) 2D UMAP plot of the 48 h post-mitotic V0v spinal interneuron single-cell RNA-seq atlas (2860 cells). Cells were obtained from 48 h embryos produced from an incross of evx1i232/+;evx2sa140/+ heterozygous parents homozygous for Tg(evx1:EGFP)SU2. Clusters are color-coded by cell identity: V0v WT Group 1 (light green), V0v WT Group 2 (dark green), V0v Mutant Group 1 (turquoise), V0v Mutant Group 2 (light blue), and V0v Mutant Group 3 (dark blue). For ease of cell type comparison, panel 9A has been reproduced from Fig. 6A. (B-S) 2D UMAP plots of differential gene expression between cell clusters. Black shows high levels of expression, light grey shows low levels of expression. All expression data have been normalized (see Methods). (B) ccdc3a, (C) dachc, (D) luzp1, (E) mycb, (F) nr5a2, (G) pou3f1, (H) pou3f2b, (I) pou3f3b, (J) scrt2, (K) pou2f2a, (L) pou2f2b, (M) mafba, (N) pbx1b, (O) scrt1a, (P) zfhx3b, (Q) nr2f5, (R) ebf1a and (S) pitx2

Genes upregulated in evx1;evx2 Mutant Group 1 and 2 V0v spinal interneurons. (A) 2D UMAP plot of the 48 h post-mitotic V0v spinal interneuron single-cell RNA-seq atlas (2860 cells). Cells were obtained from 48 h embryos produced from an incross of evx1i232/+;evx2sa140/+ heterozygous parents homozygous for Tg(evx1:EGFP)SU2. Clusters are color-coded by cell identity: V0v WT Group 1 (light green), V0v WT Group 2 (dark green), V0v Mutant Group 1 (turquoise), V0v Mutant Group 2 (light blue), and V0v Mutant Group 3 (dark blue). For ease of cell type comparison, panel 10A has been reproduced from Fig. 6A. (B-I) 2D UMAP plots of differential gene expression between cell clusters. Black shows high levels of expression, light grey shows low levels of expression. All expression data have been normalized (see Methods). (B) hmx2, (C) hmx3a, (D) otpb, (E) znf385c, (F) znf385a, (G) zmat4b, (H) bhlhe22, and (I) irx1a

hmx3a expression is upregulated in a subset of V0v spinal interneurons in evx1;evx2 double mutant embryos. (A, B, D-D’’’, E-E’’’) Lateral views of (A, D-D’’’) WT and (B, E-E’’’) evx1i232;i232;evx2sa140;sa140 double mutant embryos (labeled evx1;evx2) at 30 h. Rostral, left. Dorsal, up. (C) Number of cells expressing hmx3a in a precisely-defined spinal cord region adjacent to somites 6–10 at 30 h. Data are depicted as an individual value plot and n-values are indicated below. The wider red horizontal bar depicts the mean number of cells, and the red vertical bar depicts the S.E.M. (values are provided in Table 1). All counts are an average of five embryos. Statistically significant comparison is indicated with brackets and asterisks. * P < 0.05. White circles indicate WT data and black circles indicate evx1;evx2 double mutant data. All data were first analyzed for normality using the Shapiro–Wilk test. Both data sets in C are normally distributed and so the F-test for equal variances was performed, followed by a type 2 Student’s t-test (for equal variances). P-values are provided in Table 1. (C) There is a statistically significant increase in the number of spinal interneurons expressing hmx3a in evx1;evx2 double mutant embryos. (D’, E’) in situ hybridization for hmx3a is shown in red. (D’’, E’’) Immunohistochemistry for Tg(evx1:EGFP)SU2, which exclusively labels V0v interneurons in the spinal cord [14], is shown in green. (D, D’’’, E, E’’’) Merged images. (D, E) Maximum intensity projection images. (D’-D’’’, E’-E’’’) High-magnification single confocal planes of the regions indicated by white dotted boxes in D and E. (E’’’) A subset of ventral hmx3a-expressing cells in evx1;evx2 double mutant embryos co-expresses Tg(evx1:EGFP)SU2 (white asterisks in E’’’), whereas there is no co-expression in the WT embryos (D’’’). Scale bar: (A, B, D, E) 50 µm, (D’-D’’’, E’-E’’’) 35 µm

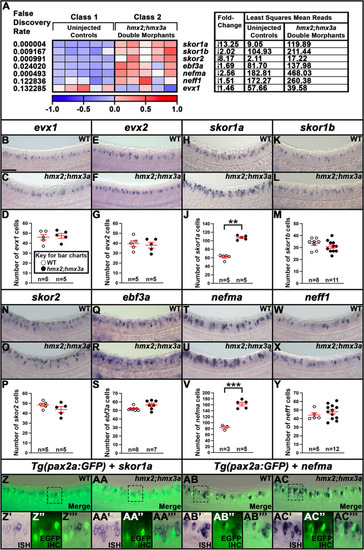
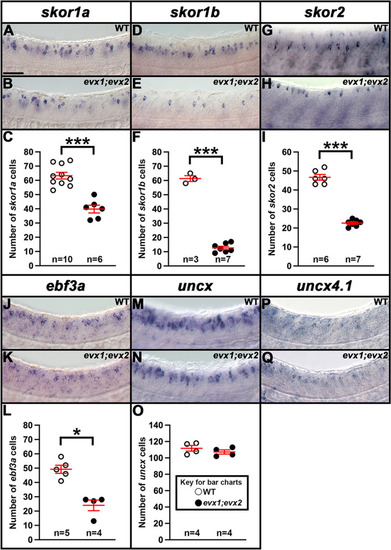
A subset of V0v spinal interneuron genes are upregulated in hmx2;hmx3a deletion mutant embryos. (A) Heatmap analysis of gene-expression profiling of 27 h Tg(hmx CNEIII:cos:Gal4-VP16,UAS:EGFP)SU41-expressing V1 and dI2 spinal cord interneurons. A two-class gene-specific analysis of differential expression was performed on different FAC-sorted populations of cells. Class 1: EGFP-positive cells from uninjected control embryos. Class 2: EGFP-positive cells from hmx2;hmx3a double knockdown (DKD) morpholino injected (morphant) embryos. Each column is a different biological replicate. Rows show relative expression levels for a subset of V0v candidate genes, shown as normalized data transformed to a mean of 0, with standard deviation of + 1 (highly expressed, red) or -1 (weakly/not expressed, blue) sigma units. Adjusted P-values corrected for multiple testing (false discovery rate values) are shown on the left-hand side. Column 1 of right-hand table indicates fold-change reduction (↓) in uninjected controls compared to hmx2;hmx3a DKD morphant embryos. Columns 2 and 3 of right-hand table show least squares mean read counts for uninjected controls and hmx2;hmx3a DKD morphant embryos respectively. evx2 expression was not detected in either WT or morphant cells in this experiment. (B, C, E, F, H, I, K, L, N, O, Q, R, T, U, W, X, Z-AC’’’) Lateral views of (B, E, H, K, N, Q, T, W, Z-Z’’’, AB-AB’’’) homozygous WT and (C, F, I, L, O, R, U, X, AA-AA’’’, AC-AC’’’) homozygous hmx2;hmx3aSU44;SU44 deletion mutant embryos at 27 h. Rostral, left. Dorsal, up. (D, G, J, M, P, S, V, Y) Number of cells expressing (D) evx1, (G) evx2, (J) skor1a, (M) skor1b, (P) skor2, (S) ebf3a, (V) nefma and (Y) neff1 in a precisely-defined spinal cord region adjacent to somites 6–10 at 27 h. Data are depicted as individual value plots with n-values provided below. For each plot, the wider red horizontal bar depicts the mean number of cells, and the red vertical bar depicts the S.E.M. (values are provided in Table 1). All counts are an average of at least three embryos. Statistically significant comparisons are indicated with brackets and asterisks. *** P < 0.001. ** P < 0.01. White circles indicate WT and black circles indicate data from homozygous hmx2; hmx3aSU44;SU44 mutants. All data were first analyzed for normality using Shapiro–Wilk test. Data sets in J and S are not normally distributed and Wilcoxon-Mann–Whitney tests were performed. Data sets in D, G, M, P, V and Y are normally distributed and so an F-test for equal variances was performed, followed by a type 2 Student’s t-test (for equal variances). P-values are provided in Table 1. (J, V) There is a statistically significant increase in the number of spinal interneurons expressing skor1a and nefma, but not (D, G, M, P, S, Y) evx1, evx2, skor1b, skor2, ebf3a, or neff1 in homozygous hmx2; hmx3aSU44;SU44 mutant embryos. in situ hybridization for (Z’, AA’) skor1a and (AB’, AC’) nefma genes is shown in dark blue. (Z’’, AA’’, AB’’, AC’’) Immunohistochemistry for Tg(pax2a:GFP), which specifically labels V1 interneurons in the spinal cord [6], is shown in green. (Z, Z’’’, AA, AA’’’, AB, AB’’’, AC, AC’’’) Merged images. (Z, AA, AB, AC) Maximum intensity projection images. (Z’-Z’’’, AA’-AA’’’, AB’-AB’’’, AC’-AC’’’) High-magnification single confocal planes of the regions indicated by black dotted boxes in Z, AA, AB, and AC. (AA’’’, AC’’’) The increased numbers of cells expressing (AA’’’’) skor1a or (AC’’’) nefma in (AA’’’, AC’’’) homozygous hmx2;hmx3aSU44;SU44 mutant embryos do not co-express Tg(pax2a:GFP), suggesting that the cells that have upregulated skor1a and nefma expression in these mutants are not V1 spinal interneurons. (B, C) evx1, (E, F) evx2 and (Q, R) ebf3a in situ hybridization experiments were performed with the molecular crowding reagent Dextran Sulfate. This was omitted for (H, I) skor1a, (K, L) skor1b, (N, O) skor2, (T, U) nefma and (W, X) neff1 in situ hybridization experiments. Scale bar: (B, C, E, F, H, I, K, L, N, O, Q, R, T, U, W, X, Z, AA, AB, AC) 50 µm, (Z’-Z’’’, AA’-AA’’’, AB’-AB’’’, AC’-AC’’’) 20 µm

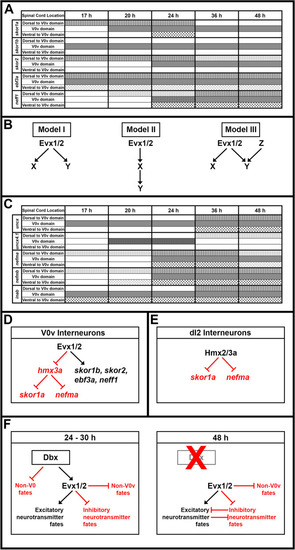
Possible GRNs downstream of Evx1/2 in V0v spinal interneurons. (A) Schematic summary of temporal expression profiles of skor1a (row 1), skor1b (row 2), skor2 (row 3), ebf3a (row 4) and neff1 (row 5) in the zebrafish spinal cord at 17 h (column 2), 20 h (column 3), 24 h (column 4), 36 h (column 5) and 48 h (column 6) (for in situ hybridization data, please see Fig. 2F-Y, AT-AX). Column 1 lists the location of the expression in the spinal cord. Strong expression in the V0v domain is shown in solid gray. Weak expression in the V0v domain is shown in dark cross-hatching. Expression dorsal to the V0v domain is depicted by either dark (strong expression) or light grey (weak expression) vertical lines. Expression ventral to the V0v domain is represented by either dark (strong expression) or light grey (weak expression) dots. (B) Possible models that explain the temporal expression profiles of candidate GRN genes downstream of Evx1/2 in V0v spinal interneurons (Fig. 2). Model I shows parallel pathways of activation of genes X and Y downstream of Evx1/2. This model may explain the activation of genes that are expressed at similar times in V0v interneurons. In contrast, genes that are expressed at different times may be explained by at least two different models. Model II shows a hierarchical pathway of gene activation downstream of Evx1/2. Evx1/2 activates gene X and the protein product of X then activates gene Y. In this case gene X will be expressed before gene Y. Finally, Model III shows the parallel activation of gene Y by both Evx1/2 and the protein product of gene Z. In this case gene Y will only be expressed when Evx1/2 and Y are expressed and if Y is expressed later than Evx1/2, genes activated by this method will be expressed later than genes activated just by Evx1/2. For simplicity, in these models, we are showing a single step direct gene activation for each step of the pathway. However, as studies have shown for other spinal cord neurons, it is possible that V0v spinal interneuron fates are not specified directly but rather, via a repression of repression mechanism (e.g. [10, 74, 9397]). (C) Temporal expression profiles of uncx (row 1), uncx4.1 (row 2), nefma (row 3), nefmb (row 4) and inab (row 5) in the zebrafish spinal cord at 17 h (column 2), 20 h (column 3), 24 h (column 4), 36 h (column 5) and 48 h (column 6) (for in situ hybridization data, please see Fig. 2Z-AS, AY-AAC). Column 1 lists the location of the expression in the spinal cord. Strong expression in the V0v domain is shown in solid gray. Weak expression in the V0v domain is shown in dark cross-hatching. Expression dorsal to the V0v domain is depicted by either dark (strong expression) or light grey (weak expression) vertical lines. Expression ventral to the V0v domain is represented by either dark (strong expression) or light grey (weak expression) dots. (D) Our data suggest that Evx1/2 may regulate the expression of skor1a and nefma in V0v spinal interneurons by repressing the expression of hmx3a (shown in red). In contrast, the expression of skor1b, skor2, ebf3a and neff1, although dependent on Evx1/2, is independent of hmx3a. (E) Our data suggest that in excitatory dI2 spinal interneurons, hmx3a might repress the expression of non-dI2 fates by repressing the expression of skor1a and nefma. (F) Possible model that explains our scRNA-seq data for Mutant Group 3 cells. At 24–30 h, dbx1a and dbx1b expression persists in zebrafish V0v spinal interneurons as they become post-mitotic and start to differentiate. Together, Dbx and Evx1/2 repress non-V0v fates in WT cells. Evx1/2 are also required to specify the excitatory neurotransmitter fates of WT V0v spinal interneurons and repress inhibitory neurotransmitter fates. In the absence of Evx1/2, at 24–30 h, double mutant evx1i232/i232;evx2sa140/sa140 cells switch their neurotransmitter fates from excitatory to inhibitory, but they do not change their V0v identities (their axon trajectories are unchanged and they do not ectopically express En1b)[14]. In contrast, by 48 h, dbx1a/b are no longer expressed in V0v spinal interneurons, and Evx1/2 is now needed to maintain V0v cell fates by repressing other inhibitory interneuron and motoneuron fates. Consequently, double mutant cells begin to transfate and adopt inhibitory, non-V0v fates by 48 h

Acknowledgments
This image is the copyrighted work of the attributed author or publisher, and ZFIN has permission only to display this image to its users. Additional permissions should be obtained from the applicable author or publisher of the image. Full text @ Neural Dev.