
Fig. 1
- ID
- ZDB-FIG-231201-35
- Publication
- England et al., 2023 - Molecular analyses of zebrafish V0v spinal interneurons and identification of transcriptional regulators downstream of Evx1 and Evx2 in these cells
- Other Figures
- All Figure Page
- Back to All Figure Page
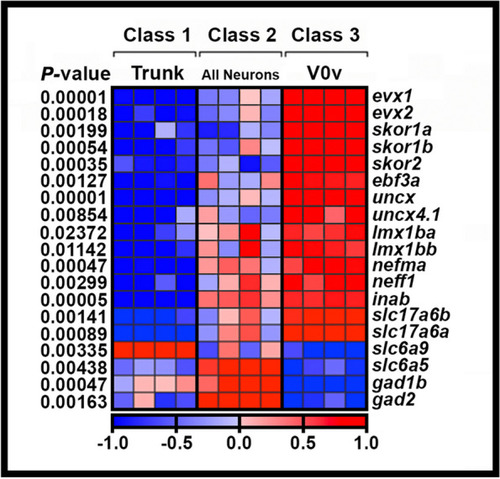
Transcriptional profiling of V0v spinal interneurons. Heatmap analysis of gene-expression profiling of 27 h V0v spinal cord interneurons. A three-class ANOVA analysis of differential expression was performed on different FAC-sorted populations of cells. Class 1: All trunk cells. Class 2: All post-mitotic spinal neurons. Class 3: V0v interneurons. Each column is a different biological replicate. Rows show relative expression levels for a single gene as normalized data transformed to a mean of 0, with standard deviation of + 1 (highly expressed, red) or -1 (weakly/not expressed, blue) sigma units. Adjusted |