IMAGE

Fig. 10

ID
ZDB-IMAGE-231201-44
Source
Figures for England et al., 2023
Image
Figure Caption

Fig. 10

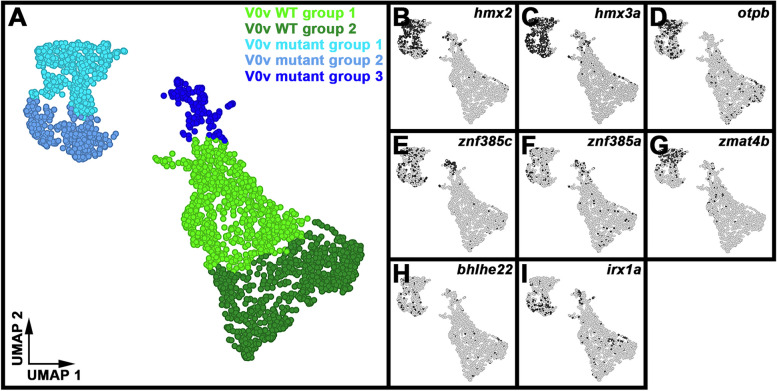
Genes upregulated in evx1;evx2 Mutant Group 1 and 2 V0v spinal interneurons. (A) 2D UMAP plot of the 48 h post-mitotic V0v spinal interneuron single-cell RNA-seq atlas (2860 cells). Cells were obtained from 48 h embryos produced from an incross of evx1i232/+;evx2sa140/+ heterozygous parents homozygous for Tg(evx1:EGFP)SU2. Clusters are color-coded by cell identity: V0v WT Group 1 (light green), V0v WT Group 2 (dark green), V0v Mutant Group 1 (turquoise), V0v Mutant Group 2 (light blue), and V0v Mutant Group 3 (dark blue). For ease of cell type comparison, panel 10A has been reproduced from Fig. 6A. (B-I) 2D UMAP plots of differential gene expression between cell clusters. Black shows high levels of expression, light grey shows low levels of expression. All expression data have been normalized (see Methods). (B) hmx2, (C) hmx3a, (D) otpb, (E) znf385c, (F) znf385a, (G) zmat4b, (H) bhlhe22, and (I) irx1a

Acknowledgments
This image is the copyrighted work of the attributed author or publisher, and ZFIN has permission only to display this image to its users. Additional permissions should be obtained from the applicable author or publisher of the image. Full text @ Neural Dev.