FIGURE

Fig. 2

ID
ZDB-FIG-231201-36
Publication
England et al., 2023 - Molecular analyses of zebrafish V0v spinal interneurons and identification of transcriptional regulators downstream of Evx1 and Evx2 in these cells
Other Figures
All Figure Page
Back to All Figure Page
Fig. 2

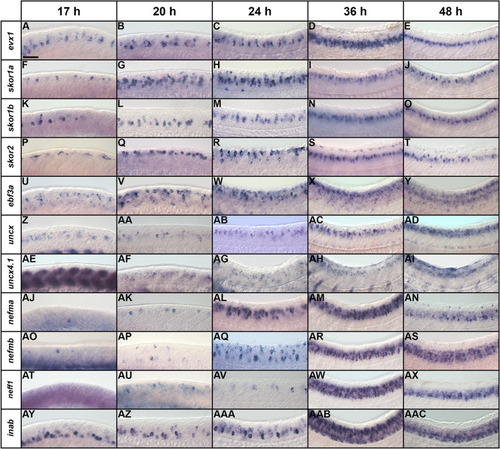
Temporal expression profiles of V0v candidate genes in zebrafish spinal cord. (A-AAC) Lateral views of (A-E) evx1, (F-J) skor1a, (KO) skor1b, (PT) skor2, (U-Y) ebf3a, (Z-AD) uncx, (AE-AI) uncx4.1, (AJ-AN) nefma, (AO-AS) nefmb, (AT-AX) neff1, and (AY-AAC) inab expression in WT spinal cord at (A, F, K, P, U, Z, AE, AJ, AO, AT, AY) 17 h, (B, G, L, Q, V, AA, AF, AK, AP, AU, AZ) 20 h, (C, H, M, R, W, AB, AG, AL, AQ, AV, AAA) 24 h, (D, I, N, S, X, AC, AH, AM, AR, AW, AAB) 36 h, and (E, J, O, T, Y, AD, AI, AN, AS, AX, AAC) 48 h. Rostral, left. Dorsal, up. (A-E) evx1 is exclusively expressed in V0v spinal interneurons at all developmental stages analyzed and is shown here as a reference. Scale bar: 50 µm

Expression Data

Expression Detail
Antibody Labeling
Phenotype Data

Phenotype Detail
Acknowledgments
This image is the copyrighted work of the attributed author or publisher, and ZFIN has permission only to display this image to its users. Additional permissions should be obtained from the applicable author or publisher of the image. Full text @ Neural Dev.