IMAGE

Fig. 2

ID
ZDB-IMAGE-231201-36
Source
Figures for England et al., 2023
Image
Figure Caption

Fig. 2

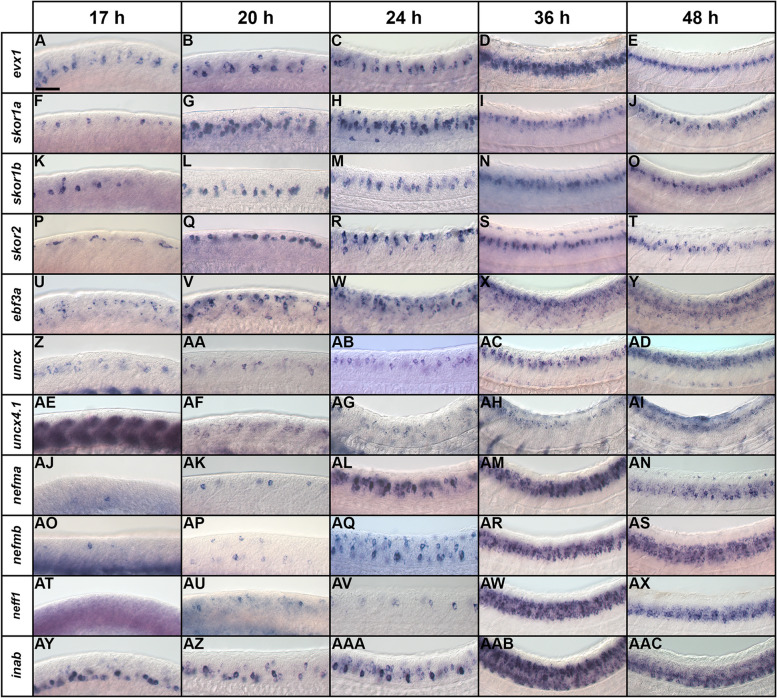
Temporal expression profiles of V0v candidate genes in zebrafish spinal cord. (A-AAC) Lateral views of (A-E) evx1, (F-J) skor1a, (KO) skor1b, (PT) skor2, (U-Y) ebf3a, (Z-AD) uncx, (AE-AI) uncx4.1, (AJ-AN) nefma, (AO-AS) nefmb, (AT-AX) neff1, and (AY-AAC) inab expression in WT spinal cord at (A, F, K, P, U, Z, AE, AJ, AO, AT, AY) 17 h, (B, G, L, Q, V, AA, AF, AK, AP, AU, AZ) 20 h, (C, H, M, R, W, AB, AG, AL, AQ, AV, AAA) 24 h, (D, I, N, S, X, AC, AH, AM, AR, AW, AAB) 36 h, and (E, J, O, T, Y, AD, AI, AN, AS, AX, AAC) 48 h. Rostral, left. Dorsal, up. (A-E) evx1 is exclusively expressed in V0v spinal interneurons at all developmental stages analyzed and is shown here as a reference. Scale bar: 50 µm

Acknowledgments
This image is the copyrighted work of the attributed author or publisher, and ZFIN has permission only to display this image to its users. Additional permissions should be obtained from the applicable author or publisher of the image. Full text @ Neural Dev.