
- Title
-
Cold-induced muscle atrophy in zebrafish: Insights from swimming activity and gene expression analysis
- Authors
- Ikeda, D., Fujita, S., Toda, K., Yaginuma, Y., Kan-No, N., Watabe, S.
- Source
- Full text @ Biochem Biophys Rep
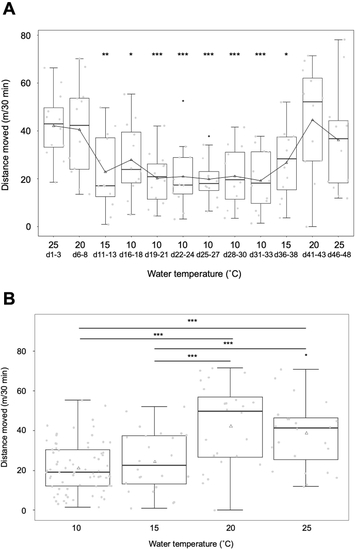
The relationship between temperature and swimming activity of zebrafish. A box plot was used to illustrate the distances moved by zebrafish in each experimental group. Black dots indicate outliers. Triangle markers represent the average distances moved. A. Changes in swimming activity in response to temperature variations. Voluntary swimming activity decreases with lower temperatures but increases as temperatures rise. Asterisks indicate significant differences compared to swimming activities at the initial water temperature of 25 °C (vs 25 d1-3; *: p < 0.05, **: p < 0.01, ***: p < 0.001). B. Swimming activity at different temperatures. A significant difference in distance moved was observed between temperatures of 20 °C and 15 °C. In the post-hoc test, asterisks are used to indicate statistical significance in comparisons between swimming activities at different temperatures (***: p < 0.001). PHENOTYPE:
|
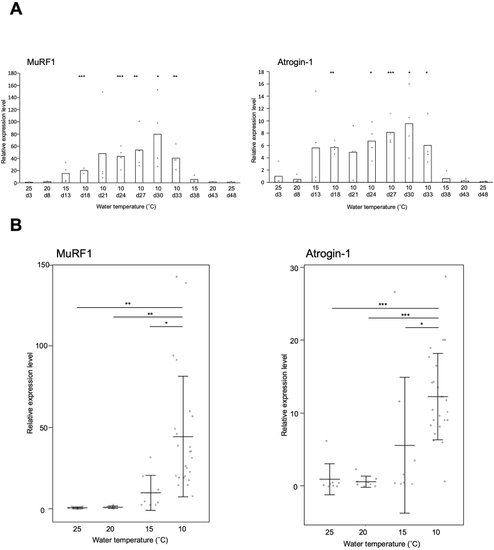
The relationship between temperature and the expression levels of MuRF1 and atrogin-1 in zebrafish muscle tissues. The relative expression levels were normalized using EF-1α as a reference and presented as a ratio to the initial water temperature of 25 °C (A; n = 4) and the water temperature of 25 °C (B; n = 8). The expression levels are presented as means (A; n = 4) and means ± standard deviations (B; 25, 20, and 15 °C: n = 8; 10 °C: n = 24). A. Asterisks indicate significant differences compared to the relative expression level at the initial water temperature of 25 °C (vs 25 d3; *: p < 0.05, **: p < 0.01, ***: p < 0.001). B. In the post-hoc test, asterisks indicate statistical significance in comparisons between expression levels at different temperatures (*: p < 0.05, **: p < 0.01, ***: p < 0.001). |
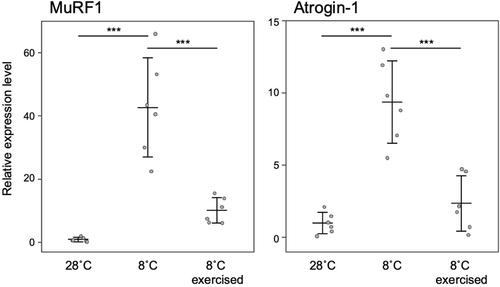
The relationship between forced exercise and the expression levels of MuRF1 and atrogin-1 in low temperature rearing. The relative expression levels were normalized using EF-1α as a reference and presented as a ratio to the levels at a water temperature of 28 °C. The expression levels are presented as means ± standard deviations (n = 6). In the post-hoc test, asterisks indicate statistical significance in comparisons between expression levels under different conditions (***: p < 0.001). |