
Fig. 2
- ID
- ZDB-FIG-231115-13
- Publication
- Ikeda et al., 2023 - Cold-induced muscle atrophy in zebrafish: Insights from swimming activity and gene expression analysis
- Other Figures
- All Figure Page
- Back to All Figure Page
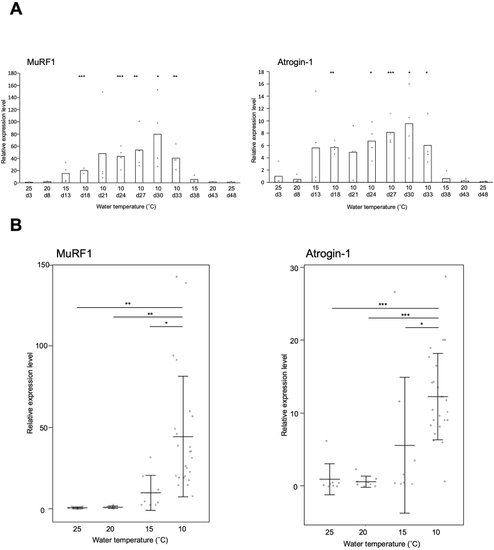
The relationship between temperature and the expression levels of MuRF1 and atrogin-1 in zebrafish muscle tissues. The relative expression levels were normalized using EF-1α as a reference and presented as a ratio to the initial water temperature of 25 °C (A; n = 4) and the water temperature of 25 °C (B; n = 8). The expression levels are presented as means (A; n = 4) and means ± standard deviations (B; 25, 20, and 15 °C: n = 8; 10 °C: n = 24). A. Asterisks indicate significant differences compared to the relative expression level at the initial water temperature of 25 °C (vs 25 d3; *: p < 0.05, **: p < 0.01, ***: p < 0.001). B. In the post-hoc test, asterisks indicate statistical significance in comparisons between expression levels at different temperatures (*: p < 0.05, **: p < 0.01, ***: p < 0.001). |
| Genes: | |
|---|---|
| Fish: | |
| Condition: | |
| Anatomical Term: | |
| Stage: | Adult |
| Fish: | |
|---|---|
| Condition: | |
| Observed In: | |
| Stage: | Adult |