
FIGURE
Fig. 3
- ID
- ZDB-FIG-231115-14
- Publication
- Ikeda et al., 2023 - Cold-induced muscle atrophy in zebrafish: Insights from swimming activity and gene expression analysis
- Other Figures
- All Figure Page
- Back to All Figure Page
Fig. 3
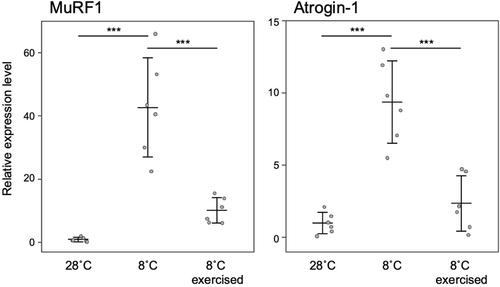
The relationship between forced exercise and the expression levels of MuRF1 and atrogin-1 in low temperature rearing. The relative expression levels were normalized using EF-1α as a reference and presented as a ratio to the levels at a water temperature of 28 °C. The expression levels are presented as means ± standard deviations (n = 6). In the post-hoc test, asterisks indicate statistical significance in comparisons between expression levels under different conditions (***: p < 0.001). |
Expression Data
| Genes: | |
|---|---|
| Fish: | |
| Conditions: | |
| Anatomical Term: | |
| Stage: | Adult |
Expression Detail
Antibody Labeling
Phenotype Data
| Fish: | |
|---|---|
| Conditions: | |
| Observed In: | |
| Stage: | Adult |
Phenotype Detail
Acknowledgments
This image is the copyrighted work of the attributed author or publisher, and
ZFIN has permission only to display this image to its users.
Additional permissions should be obtained from the applicable author or publisher of the image.
Full text @ Biochem Biophys Rep