
- Title
-
Perinatal exposure to potential endocrine disrupting chemicals and autism spectrum disorder: From Norwegian birth cohort to zebrafish studies
- Authors
- Desalegn, A.A., van der Ent, W., Lenters, V., Iszatt, N., Stigum, H., Lyche, J.L., Berg, V., Kirstein-Smardzewska, K.J., Esguerra, C.V., Eggesbø, M.
- Source
- Full text @ Environ. Int.
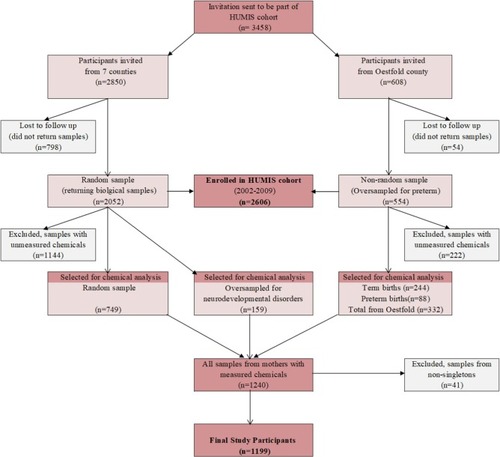
Flow chart showing selection of the study participants from the HUMIS cohort. |
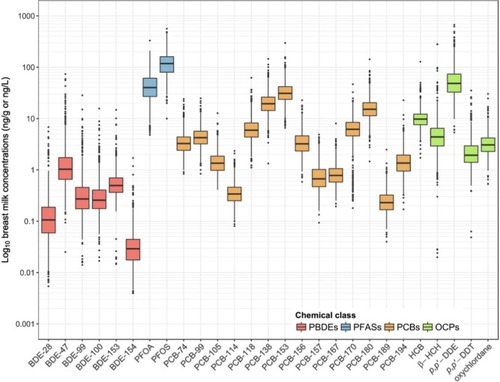
Boxplot distributions of the measured breast milk concentration of the 27 chemicals. Horizontal lines correspond to medians, and boxes to the 25th–75th percentiles; whiskers extend to data within the interquartile range times 1.5, data beyond this are plotted as dots. Wet weight concentrations are presented for PFASs (ng/L) and lipid adjusted concentrations for all other toxicants (ng/g). (See supplementary material Table S1 for numerical values.) This figure was reproduced from Lenters et al., 2019., under a Creative Commons license (CC BY 4.0.).Abbreviations: (P)BDE, (poly)brominated diphenyl ether; DDE, dichlorodiphenyldichloroethylene; DDT, dichlorodiphenyltrichloroethane; HCB, hexachlorobenzene; HCH, hexachlorocyclohexane; OCPs, organochlorine pesticides; PFASs, poly- and perfluoroalkyl substances; PFOA, perfluorooctanoate; PFOS, perfluorooctane sulfonate. |
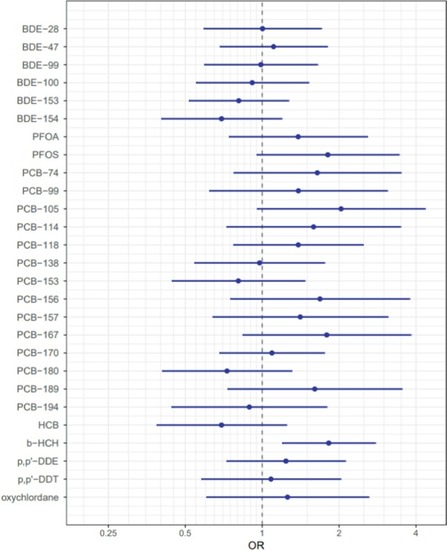
Odds ratios (OR) and 95% confidence intervals for autism spectrum disorders (ASD) per interquartile ratio increase in ln-transformed measured exposure breast milk concentrations from HUMIS cohort, Norway. Coefficients from single-exposure logistic regression models are presented. Models were adjusted for child age at linkage, maternal age, and maternal education (M1). Coefficients were similar upon further adjustment for parity, small for gestational age, preterm birth, smoking during pregnancy, pre-pregnancy BMI, cohabitation or marital status, and maternal fatty fish consumption around pregnancy (M2). (See supplementary material Table S2 for numerical values.). |
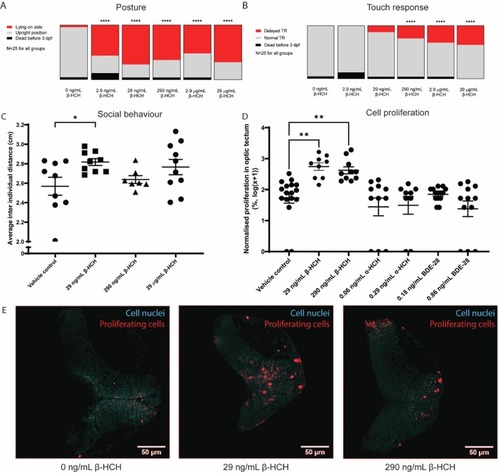
Effects of β-HCH on early developmental stage zebrafish larvae. A) Distribution of larval posture at 3 days post fertilization after exposure to β-HCH in early developmental stages. B) Distribution of larval touch response at 3 days post fertilization after exposure to β-HCH. Significance was calculated using Chi-square test. C) Effect of β-HCH on shoaling behavior in 7 days post fertilization larvae. 0 ng/mL control: N = 9; 29 ng/mL: N = 9; 290 ng/mL: N = 7; 29 μg/mL: N = 10. Error bars represent S.E.M., significance was calculated using one-way ANOVA with Dunnett’s post-test. D) Effect of β-HCH on cell proliferation in the optic tectum of 5 days post fertilization larvae. BrdU signal labelling proliferating cells was normalised to the mean of vehicle treated larvae and log transformed. 0 ng/mL control: N = 17; 29 ng/mL: N = 9; 290 ng/mL: N = 10. 0.06 ng/mL α-HCH: N = 11; 0.29 ng/mL α-HCH: N = 9; 0.18 ng/mL BDE-28: N = 14, 0.86 ng/mL BDE-28: N = 11. Error bars represent S.E.M., significance was calculated using a Kruskal-Wallis H test with Dunn’s post-test. E) Representative images of BrdU staining in optic tectum of 5 days post fertilization larvae after β-HCH treatment. Red: BrdU-labeled proliferating cells, cyan: nuclear staining. (For interpretation of the references to colour in this figure legend, the reader is referred to the web version of this article.) PHENOTYPE:
|
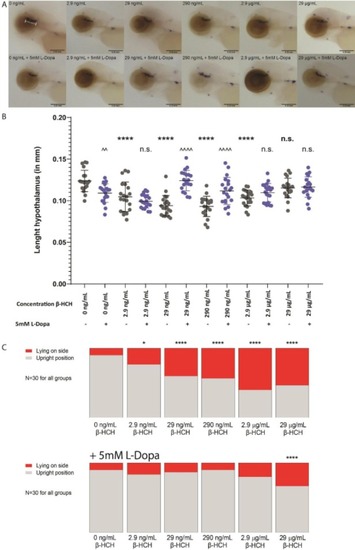
Whole-mount in situ hybridization analysis with TH1 probe in a 3 days post fertilization embryo, exposure to β-HCH, additional L-Dopa treatment, and distribution of larval posture. A) Whole-mount in situ hybridization analysis with TH1 probe in a 3 days post fertilization embryo. The hypothalamus is indicated in the upper left panel by a white bar. Upper panels are representative larvae treated with β-HCH at the indicated concentrations. Lower panels are representative images of larvae treated 5 mM L-Dopa in addition to indicated concentrations of β-HCH. Scale bars are 0.25 mm. B) Length of the hypothalamus of 3 days post fertilization embryos exposed to indicated concentrations of β-HCH, with (blue) or without (grey) additional L-Dopa treatment. Error bars represent S.E.M., significance was calculated using one-way ANOVA with Dunnett’s post-test. The ‘*’ symbol is used to indicate significance of difference compared to the 0 ng/mL group. The ‘^’ is used to indicate significance of differences between groups treated with the same concentration of β-HCH, with or without 5 mM L-Dopa. C) Distribution of larval posture at 3 days post fertilization after exposure to β-HCH in early developmental stages, without (upper panel) or with (lower panel) simultaneous exposure to 5 mM L-Dopa. Significance was calculated using Chi-square test. (For interpretation of the references to colour in this figure legend, the reader is referred to the web version of this article.) EXPRESSION / LABELING:
PHENOTYPE:
|