
Fig. 2
- ID
- ZDB-FIG-240215-2
- Publication
- Desalegn et al., 2023 - Perinatal exposure to potential endocrine disrupting chemicals and autism spectrum disorder: From Norwegian birth cohort to zebrafish studies
- Other Figures
- All Figure Page
- Back to All Figure Page
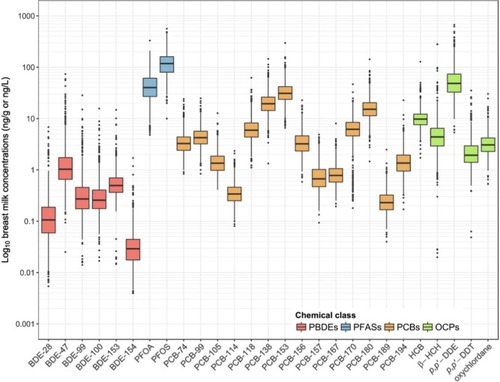
Boxplot distributions of the measured breast milk concentration of the 27 chemicals. Horizontal lines correspond to medians, and boxes to the 25th–75th percentiles; whiskers extend to data within the interquartile range times 1.5, data beyond this are plotted as dots. Wet weight concentrations are presented for PFASs (ng/L) and lipid adjusted concentrations for all other toxicants (ng/g). (See supplementary material Table S1 for numerical values.) This figure was reproduced from Lenters et al., 2019., under a Creative Commons license (CC BY 4.0.).Abbreviations: (P)BDE, (poly)brominated diphenyl ether; DDE, dichlorodiphenyldichloroethylene; DDT, dichlorodiphenyltrichloroethane; HCB, hexachlorobenzene; HCH, hexachlorocyclohexane; OCPs, organochlorine pesticides; PFASs, poly- and perfluoroalkyl substances; PFOA, perfluorooctanoate; PFOS, perfluorooctane sulfonate. |