
|
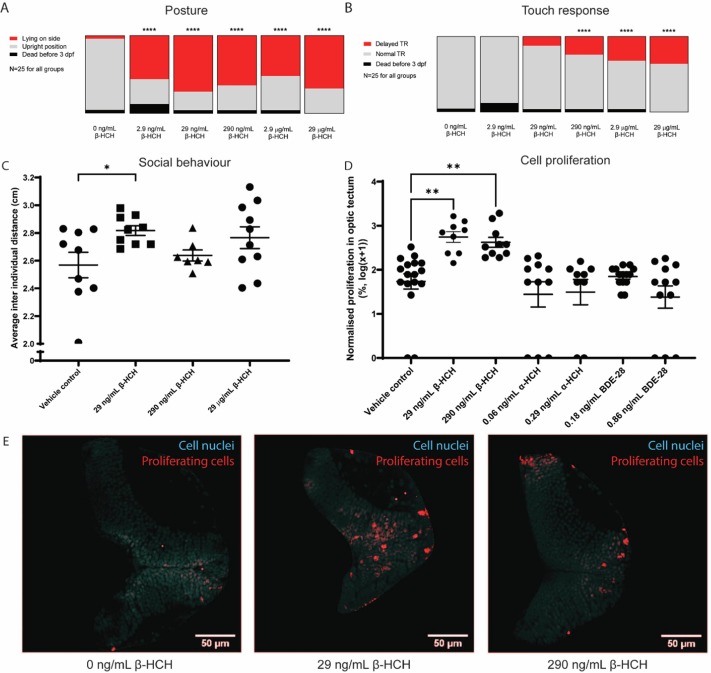
Fig. 4 Effects of β-HCH on early developmental stage zebrafish larvae. A) Distribution of larval posture at 3 days post fertilization after exposure to β-HCH in early developmental stages. B) Distribution of larval touch response at 3 days post fertilization after exposure to β-HCH. Significance was calculated using Chi-square test. C) Effect of β-HCH on shoaling behavior in 7 days post fertilization larvae. 0 ng/mL control: N = 9; 29 ng/mL: N = 9; 290 ng/mL: N = 7; 29 μg/mL: N = 10. Error bars represent S.E.M., significance was calculated using one-way ANOVA with Dunnett’s post-test. D) Effect of β-HCH on cell proliferation in the optic tectum of 5 days post fertilization larvae. BrdU signal labelling proliferating cells was normalised to the mean of vehicle treated larvae and log transformed. 0 ng/mL control: N = 17; 29 ng/mL: N = 9; 290 ng/mL: N = 10. 0.06 ng/mL α-HCH: N = 11; 0.29 ng/mL α-HCH: N = 9; 0.18 ng/mL BDE-28: N = 14, 0.86 ng/mL BDE-28: N = 11. Error bars represent S.E.M., significance was calculated using a Kruskal-Wallis H test with Dunn’s post-test. E) Representative images of BrdU staining in optic tectum of 5 days post fertilization larvae after β-HCH treatment. Red: BrdU-labeled proliferating cells, cyan: nuclear staining. (For interpretation of the references to colour in this figure legend, the reader is referred to the web version of this article.)