
- Title
-
Elongation of the developing spinal cord is driven by Oct4-type transcription factor-mediated regulation of retinoic acid signaling in zebrafish embryos
- Authors
- Yuikawa, T., Sato, T., Ikeda, M., Tsuruoka, M., Yasuda, K., Sato, Y., Nasu, K., Yamasu, K.
- Source
- Full text @ Dev. Dyn.
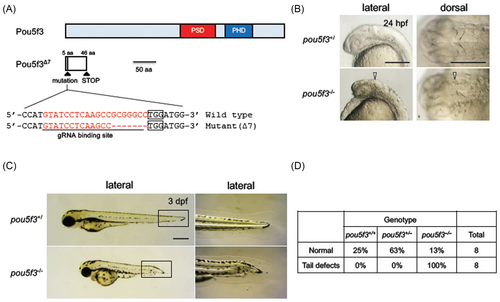
Disruption and activation of the functions of Pou5f3 in zebrafish. (A) The schematic view of the wild-type and mutant Pou5f3 (Pou5f3∆7). The coding region and the nonsense region due to a frame shift are shown with light blue and white boxes, respectively. The target site of CRISPR/Cas9-mediated disruption is shown below the scheme of the Pou5f3 protein. The sense sequence for the gRNA and PAM sequences are shown with an underline and boxes, respectively. The disruption was found to be a 7-bp deletion that will cause a frameshift mutation (pou5f3∆7). PSD, POU-specific domain; PHD, POU homeodomain. (B) Phenotypes observed in the heads of pou5f3 mutants at 24 hpf. Disruption of the isthmus is shown with triangles. (C) Phenotypes observed in pou5f3 mutants at 3 dpf. The boxed areas in the left panels are enlarged on the right. (D) Morphology of the tail at 3 dpf for different genotypes (wild-type, heterozygotes, and homozygotes). Eight of normal embryos and tail-deformed embryos were randomly selected and genotyped by HMA. HMA, heteroduplex mobility assay. |
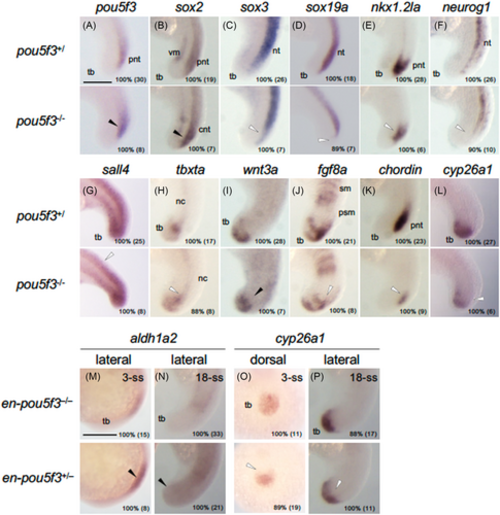
Effects of pou5f3 mutation and en-pou5f3 induction on the expression of genes regulating posterior development. (A–L) Expression of regulatory genes in the tail region in pou5f3 mutants at 18 hpf. For each gene examined, wild-type/heterozygote (+/−) and homozygote (−/−) embryos are shown at the top and bottom, respectively. (M–P) Effects of en-pou5f3 induction at 3-ss and 18-ss on the expression of regulatory genes. For each gene examined, wild-type (−/−) and en-pou5f3 hemizygote (+/−) embryos are shown at the top and bottom, respectively. Up-regulation and down-regulation are marked with solid and open arrowheads, respectively. (A–N, P) Lateral views with anterior to the top and dorsal to the right. (O) Posterior views with anterior to the top. Percentages of embryos with the shown patterns and total embryo numbers are shown in the right-bottom. nc, notochord; nt, neural tube; pnt, posterior-most neural tube; psm, presomitic mesoderm; RA, retinoic acid; sm, somitic mesoderm; tb, tail bud; vm, ventral mesoderm. Scale bars, 200 μm. |
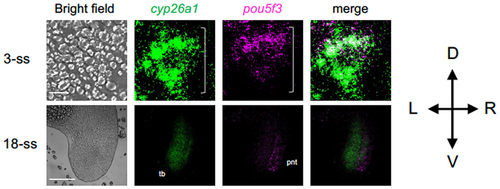
Comparison of the expression of cyp26a1 and pou5f3 in the posterior end of embryos. The expression of cyp26a1 (green) and pou5f3 (magenta) was stained by 2-color FISH at 3-ss and 18-ss. The extents of the tail bud are marked with brackets. The orientation regarding the dorsoventral (D-V) and left–right (L-R) axes are shown on the right. For abbreviations, see the legend in Figure 2. Scale bars, 200 μm. |
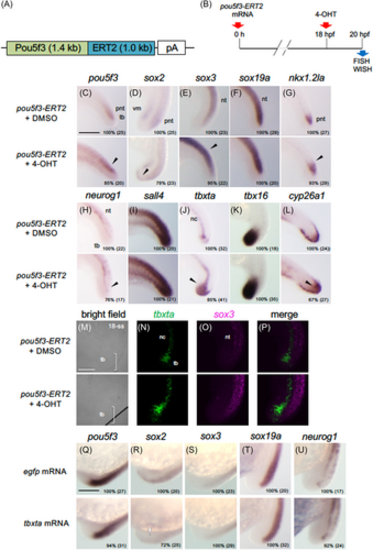
Effects of Pou5f3-ERT2 activation on the expression of genes regulating posterior development. (A) Schematic view of the Pou5f3-ERT2 fusion gene that was incorporated into pCS2+ and transcribed in vitro for mRNA microinjection. (B) Time schedule of Pou5f3-ERT2 activation by 4-OHT treatment. mRNA of 400 pg was injected into each fertilized egg, which was raised, administered with 5 μM 4-OHT at 18 hpf, and subjected to expression analyses at 20 hpf (C–P). (C–L) The expression of tail bud-related genes was examined by WISH. Up-regulation is marked with solid arrowheads. (M–P) Expression of tbxta and sox3 was stained in green and magenta, respectively, by FISH. Brackets mark the tail bud region. (Q–U) Effects of tbxta overexpression on the expression of tail bud-related genes. mRNA for egfp or tbxta was injected into embryos (100 pg/embryo), which were examined for the expression of tail bud-related genes at early somite stages. Down-regulation is marked with open arrowheads. Percentages of embryos with the shown patterns and total embryo numbers are shown in the right-bottom. For abbreviations, see the legend in Figure 2. WISH, whole-mount in situ hybridization. Scale bars, 200 μm. |
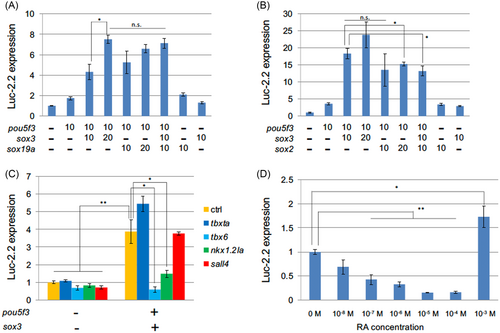
Transcriptional regulation of pou5f3 by tail bud-related genes. The expression of the luciferase gene Luc-2.2, which is under regulation of the pou5f3 regulatory region, was assayed in P19 cells that had been transfected with the expression plasmids of regulatory genes. ctrl, egfp used as control. Ordinates show the expression of Luc-2.2 relative to that in the absence of effectors. Below are the amounts of transfected effector plasmids (ng/well). Total amounts of effector DNA were adjusted with pCS2+egfp. (A, B) Transcriptional regulation of pou5f3 by soxB1 genes. Luc-2.2 expression was assayed in P19 cells that had been transfected with the effector plasmids of pou5f3 and soxB1 genes by different combinations. (C) Transcriptional regulation of pou5f3 by pou5f3, sox3, and other effector genes. (D) Expression of Luc-2.2 driven by sox3 and pou5f3 in the presence of retinoic acid at different concentrations. Except for the highest concentration, RA repressed Luc-2.2 in a dose-dependent manner. All experiments were repeated at least three times, resulting in essentially the same results. The results of t test among the data marked with horizontal bars are shown. n.s., not significant; *, p < .05; **, p < .01 |
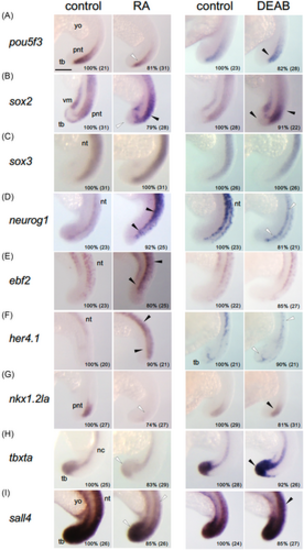
Effects of affecting the retinoic acid (RA) signaling pathway on the expression of regulatory genes involved in posterior development. Embryos were treated with vehicle (control, DMSO), RA, or DEAB from 14 to 18 hpf and subjected to WISH. Percentages of embryos with the shown patterns and total embryo numbers are shown in the right-bottom. For abbreviations, see the legend in Figures 2 and 6. WISH, whole-mount in situ hybridization. Scale bars, 200 μm. |
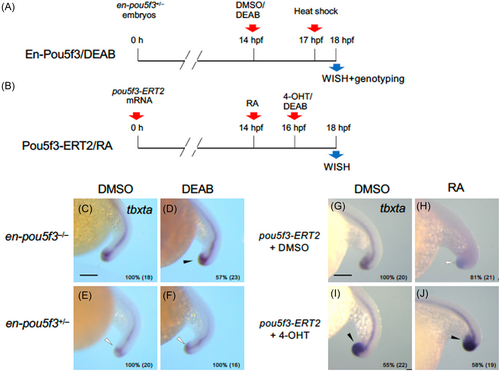
Epistasis analyses of tail bud development regarding regulation by pou5f3 and retinoic acid (RA). (A) Embryos obtained from crosses between an en-pou5f3+/− and wild-type fish were treated with DMSO or DEAB at 14 hpf, and then exposed to heat shock at 17 hpf for en-pou5f3 induction. After heat shock, embryos were immediately subjected to WISH and then genotyped to identify Tg embryos (C–F). (B) Alternatively, embryos injected with pou5f3-ERT2 mRNA were treated with DMSO or RA at 14 hpf, treated with DMSO or 4-OHT at 16 hpf, and then subjected to WISH at 18 hpf (G–J). The expression of tbxta was examined by WISH to assess tail bud development. Up-regulation and down-regulation are marked with solid and open arrowheads, respectively. Percentages of embryos with the shown patterns and total embryo numbers are shown in the right-bottom. WISH, whole-mount in situ hybridization. Scale bars, 200 μm. |
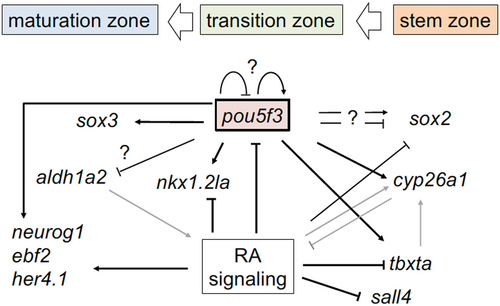
Gene regulatory network involving pou5f3 as a hub. NMPs maintained in the tail bud (stem zone) enter the transition zone, where they undergo neural specification (transit cells) and then progress into the maturation zone, where progenitors further enter the phase of neural differentiation.20 Arrows and T-shaped lines represent up-regulation and down-regulation, respectively. Black lines show regulation shown in the current study, whereas gray lines show established interactions or those reported recently.6 Thick lines show interactions confirmed by both LoF and GoF experiments, whereas thin lines show interaction inferred from LoF experiments (Table 1). The “?” marks show inconsistent results among experiments (Table 1). GoF, gain-of-function; LoF, loss-of-function; NMP, neuromesodermal progenitor. |