
Image
|
Figure Caption
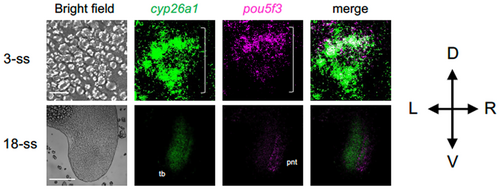
Fig. 3 Comparison of the expression of cyp26a1 and pou5f3 in the posterior end of embryos. The expression of cyp26a1 (green) and pou5f3 (magenta) was stained by 2-color FISH at 3-ss and 18-ss. The extents of the tail bud are marked with brackets. The orientation regarding the dorsoventral (D-V) and left–right (L-R) axes are shown on the right. For abbreviations, see the legend in Figure 2. Scale bars, 200 μm.
Acknowledgments
This image is the copyrighted work of the attributed author or publisher, and
ZFIN has permission only to display this image to its users.
Additional permissions should be obtained from the applicable author or publisher of the image.
Full text @ Dev. Dyn.