FIGURE SUMMARY
Title

The osteogenic and mineralogenic potential of the microalgae Skeletonema costatum and Tetraselmis striata CTP4 in fish models

Authors
Carletti, A., Rosa, J.T., Pes, K., Borges, I., Santos, T., Barreira, L., Varela, J., Pereira, H., Cancela, M.L., Gavaia, P.J., Laizé, V.
Source
Full text @ Cell. Mol. Life Sci.

A Schematic representation of the production of microalgal extracts. B Vacuum coating of commercial diets with algal extracts. C Time course and feeding table of the nutritional trial. rots rotifers

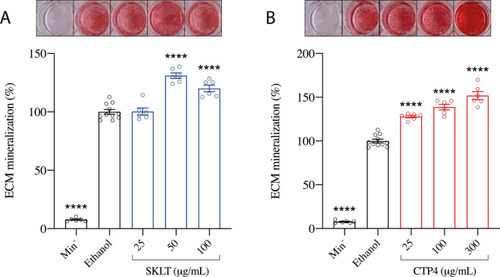
Mineralization of the extracellular matrix (ECM) of VSa13 cells exposed to ethanolic extracts prepared from ASkeletonema costatum (SKLT), and BTetraselmis striata CTP4 (CTP4). Values are presented as mean ± standard deviation and as a percentage over the control group (Ethanol, n = 6). Picture panels above each graph display images of alizarin-red-stained cell cultures. Normality was tested through Anderson–Darling test (p < 0.05). Asterisks indicate values significantly different according to one-way ANOVA followed by post hoc Dunnett’s or Kruskal–Wallis test. Each experimental group was tested against the control group (Ethanol). p < 0.0001 (****). Min No mineralogenic cocktail

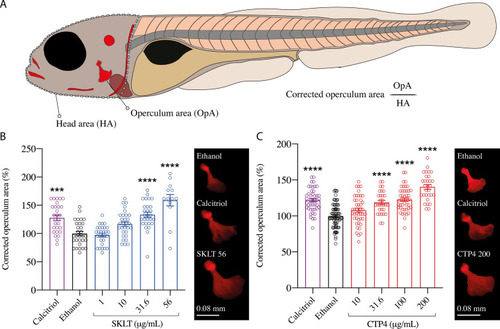
Mineralogenic effect on the operculum of 6-dpf zebrafish larvae exposed to Skeletonema costatum (SKLT) and Tetraselmis striata CTP4 (CTP4) extracts. A Composite image of a 6 dpf zebrafish larva, where operculum area (OpA) and head area (HA) are highlighted with a continuous line and a dashed line, respectively, and where AR-S stained mineralized structures detected by fluorescence microscopy appear in red. B, C Effects of SKLT (B) and CTP4 (C) on the operculum area. Values are presented as mean ± standard error and as a percentage over the negative control (Ethanol) (n > 15). The picture panels on the right side of each graph present images of opercular bones from negative and positive (calcitriol) control fish and fish exposed to the higher concentration of each extract. Normality was tested though Anderson–Darling test (p < 0.05). Asterisks indicate values significantly different according to one-way ANOVA followed by post hoc Dunnett’s or Kruskal–Wallis test. Each experimental group was tested against the negative control group (Ethanol). p < 0.0002 (***) and p < 0.0001 (****)

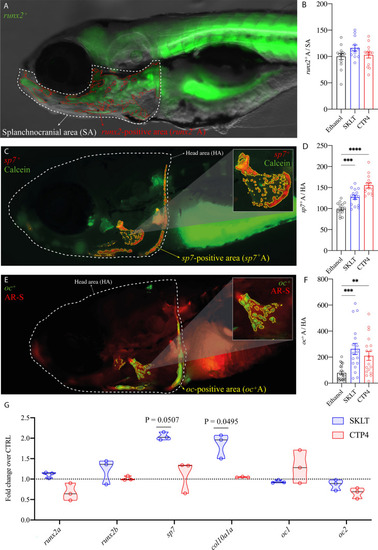
Expression of osteoblast differentiation markers in 6-dpf zebrafish larvae exposed to ethanolic extracts of Skeletonema costatum (SKLT) and Tetraselmis striata CTP4 (CTP4). Representative images of Arunx2-positive osteochondroprogenitor cells, Csp7-positive immature osteoblasts, and Eoc1-positive mature osteoblasts, and quantification of fluorescence signal area for runx2 (B), sp7 (D), and oc1 (E) positive cells. Normality was tested though Anderson–Darling test (p < 0.05). For fluorescence signals, differences were tested through one-way ANOVA or Kruskal–Wallis test. Asterisks indicate p < 0.0021 (**), p < 0.0002 (***) and p < 0.0001 (****). For gene expression, differences were tested through a non-parametric Kruskal–Wallis test, followed by a Dunn’s multiple comparison test (significant P values are reported above each treatment)

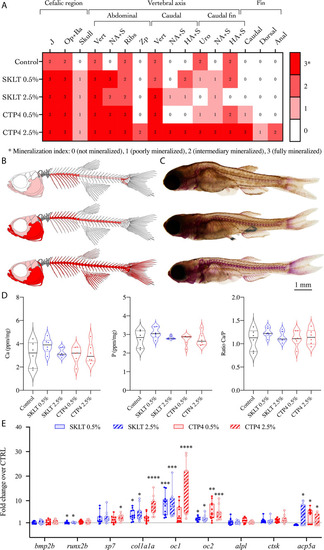
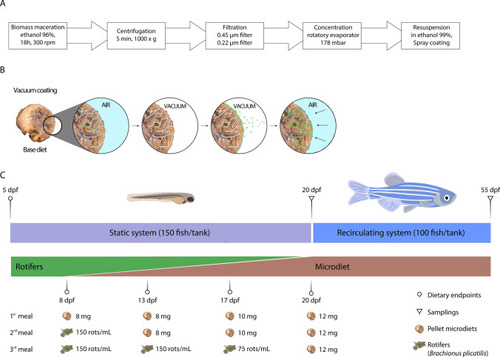
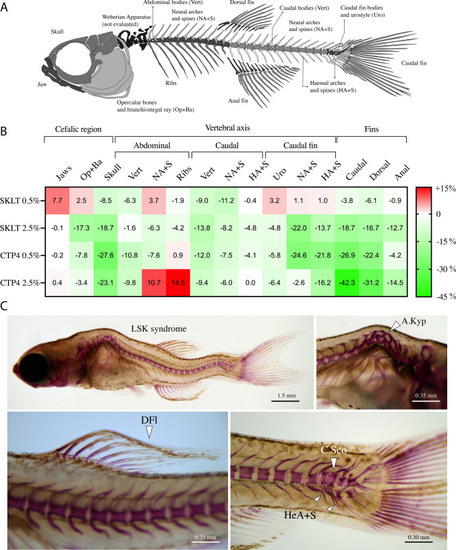
Mineralization status of zebrafish juveniles fed diets supplemented with the ethanolic extracts of Skeletonema costatum (SKLT) and Tetraselmis striata CTP4 (CTP4). A Heatmap displaying the group modal values for the mineralization index assigned to each skeletal structure. B Schematic representation of the modal mineralization status of the fish fed CTRL, SKLT 2.5% or CTP4 2.5% (from top to bottom). C Representative images of fish illustrated in C. D Content of phosphorus (P) and calcium (Ca), and Ca/P ratio in juveniles fed experimental diets. E Expression of marker genes for osteoblastic differentiation, ECM mineralization, and osteoclast function. For gene expression, differences were tested through Student’s t test. Asterisks indicate p < 0.0332 (*), p < 0.0021. (**), p < 0.0002 (***) and p < 0.0001 (****). J jaws, Op + Ba operculum and branchial arches, Vert vertebral bodies, NA + S neural arches and spines, HA + S haemal arches and spines, Uro caudal vertebrae bodies and urostyle

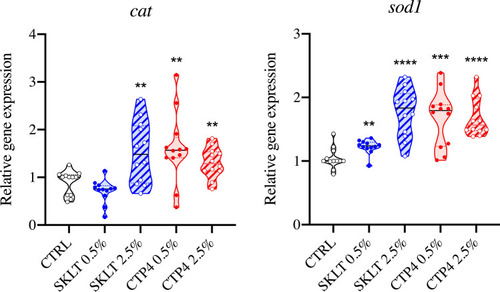
Effect of the ethanolic extracts of Skeletonema costatum (SKLT) and Tetraselmis striata CTP4 (CTP4) on the expression of antioxidant response markers in juvenile zebrafish (55 dpf). cat catalase, sod1 superoxide dismutase 1, soluble. Statistical differences between each group and the control (CTRL) were tested through Student’s t test (p < 0.05). Asterisks indicate values statistically different. p < 0.002 (**), p < 0.0002 (***), p < 0.0001 (****)

Incidence of skeletal anomalies in zebrafish juveniles fed diets supplemented with the ethanolic extracts of Skeletonema costatum (SKLT) and Tetraselmis striata CTP4 (CTP4). A Scheme illustrating the skeletal elements considered in the analysis of skeletal anomalies. B Incidence of anomalies expressed as a percentage of increment/decrement of anomalies relative to the control group (non-supplemented diet). C Representative images of commonly found skeletal anomalies in AR-S stained fish for all experimental groups. Op + Ba operculum and branchial arches, Vert vertebral bodies, NA + S neural arches and spines, HA + S haemal arches and spines, Uro caudal vertebrae bodies and urostyle, LSK lordosis–scoliosis–kyphosis, DFI deformed fin lepidotrichia, A.Kyp abdominal kyphosis, C.Sco caudal scoliosis, HeA + S deformed haemal arches and spines

Acknowledgments
This image is the copyrighted work of the attributed author or publisher, and ZFIN has permission only to display this image to its users. Additional permissions should be obtained from the applicable author or publisher of the image. Full text @ Cell. Mol. Life Sci.