IMAGE

Fig. 2

ID
ZDB-IMAGE-231003-4
Source
Figures for Carletti et al., 2023
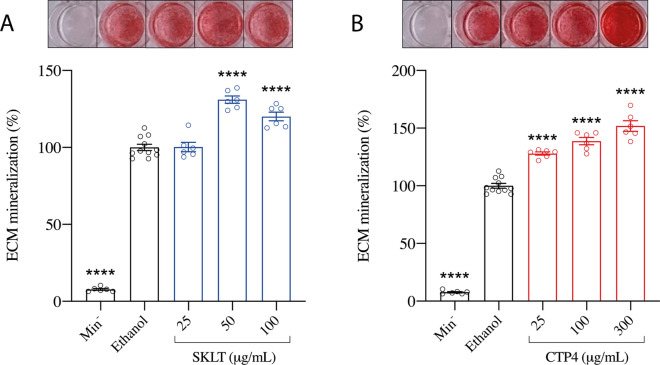
Image
Figure Caption

Fig. 2

Mineralization of the extracellular matrix (ECM) of VSa13 cells exposed to ethanolic extracts prepared from ASkeletonema costatum (SKLT), and BTetraselmis striata CTP4 (CTP4). Values are presented as mean ± standard deviation and as a percentage over the control group (Ethanol, n = 6). Picture panels above each graph display images of alizarin-red-stained cell cultures. Normality was tested through Anderson–Darling test (p < 0.05). Asterisks indicate values significantly different according to one-way ANOVA followed by post hoc Dunnett’s or Kruskal–Wallis test. Each experimental group was tested against the control group (Ethanol). p < 0.0001 (****). Min No mineralogenic cocktail

Acknowledgments
This image is the copyrighted work of the attributed author or publisher, and ZFIN has permission only to display this image to its users. Additional permissions should be obtained from the applicable author or publisher of the image. Full text @ Cell. Mol. Life Sci.