IMAGE

Fig. 5

ID
ZDB-IMAGE-231003-8
Source
Figures for Carletti et al., 2023
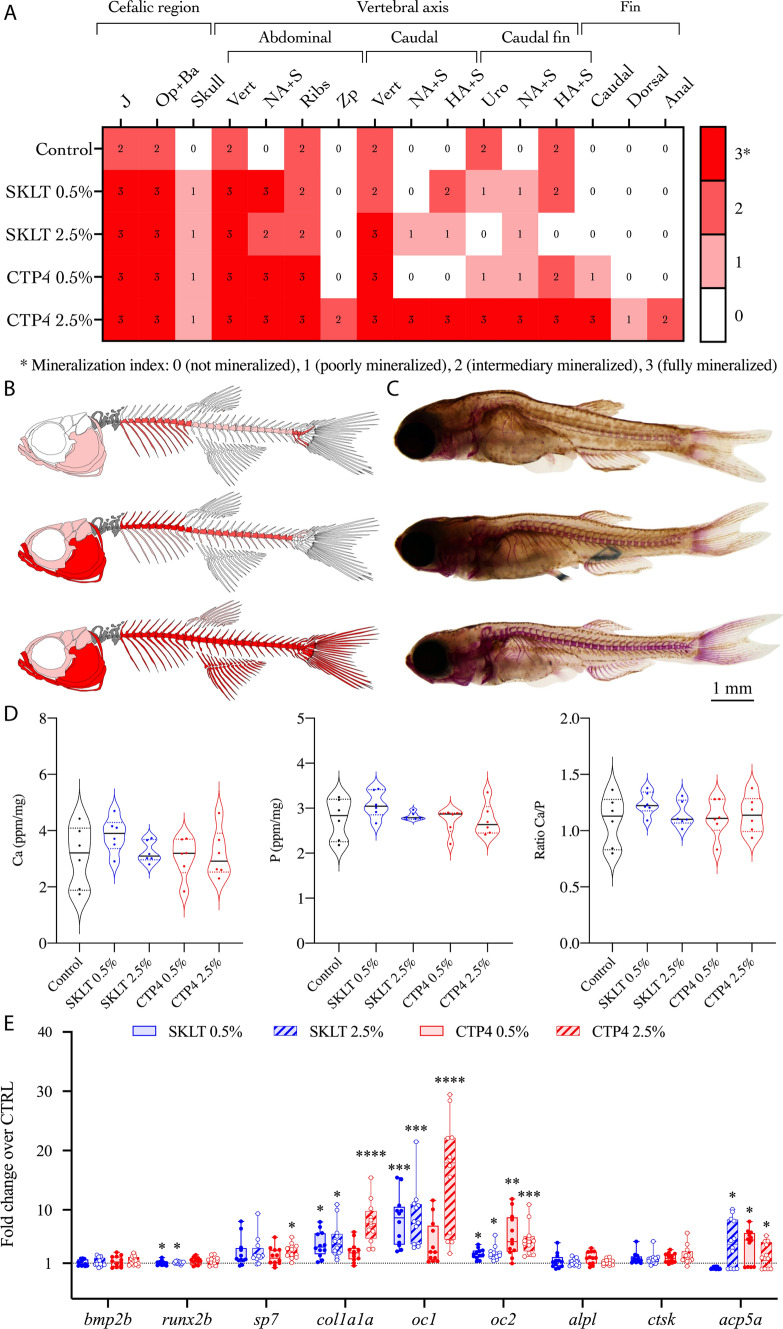
Image
Figure Caption

Fig. 5

Mineralization status of zebrafish juveniles fed diets supplemented with the ethanolic extracts of Skeletonema costatum (SKLT) and Tetraselmis striata CTP4 (CTP4). A Heatmap displaying the group modal values for the mineralization index assigned to each skeletal structure. B Schematic representation of the modal mineralization status of the fish fed CTRL, SKLT 2.5% or CTP4 2.5% (from top to bottom). C Representative images of fish illustrated in C. D Content of phosphorus (P) and calcium (Ca), and Ca/P ratio in juveniles fed experimental diets. E Expression of marker genes for osteoblastic differentiation, ECM mineralization, and osteoclast function. For gene expression, differences were tested through Student’s t test. Asterisks indicate p < 0.0332 (*), p < 0.0021. (**), p < 0.0002 (***) and p < 0.0001 (****). J jaws, Op + Ba operculum and branchial arches, Vert vertebral bodies, NA + S neural arches and spines, HA + S haemal arches and spines, Uro caudal vertebrae bodies and urostyle

Acknowledgments
This image is the copyrighted work of the attributed author or publisher, and ZFIN has permission only to display this image to its users. Additional permissions should be obtained from the applicable author or publisher of the image. Full text @ Cell. Mol. Life Sci.