IMAGE

Fig. 4

ID
ZDB-IMAGE-231003-7
Source
Figures for Carletti et al., 2023
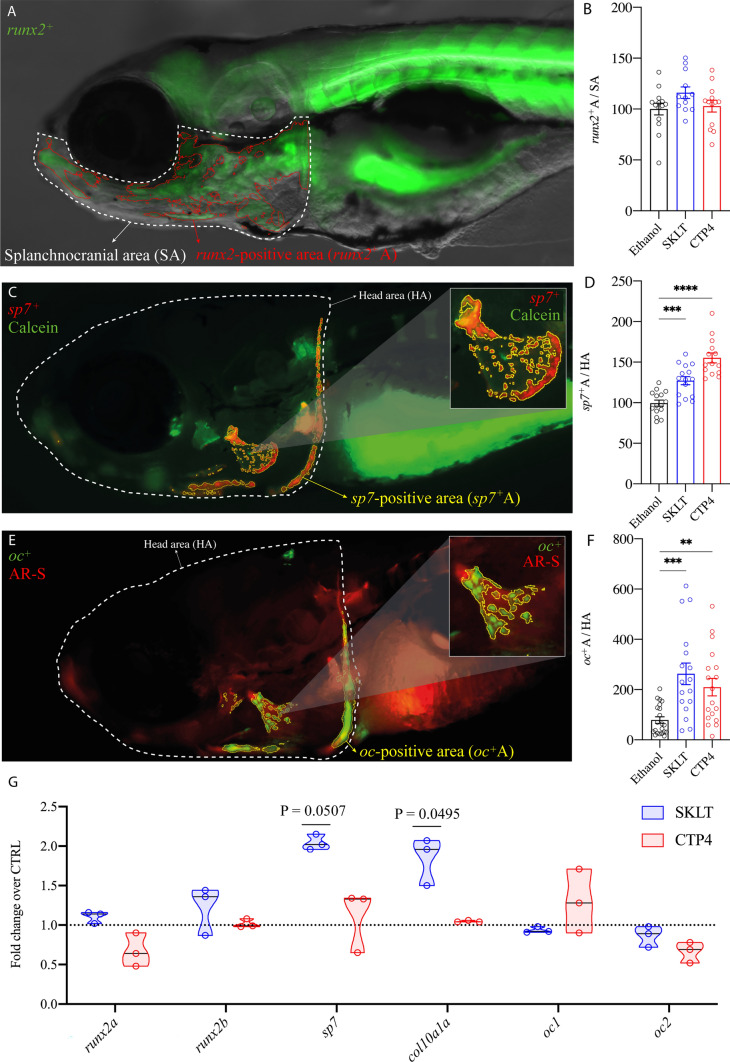
Image
Figure Caption

Fig. 4

Expression of osteoblast differentiation markers in 6-dpf zebrafish larvae exposed to ethanolic extracts of Skeletonema costatum (SKLT) and Tetraselmis striata CTP4 (CTP4). Representative images of Arunx2-positive osteochondroprogenitor cells, Csp7-positive immature osteoblasts, and Eoc1-positive mature osteoblasts, and quantification of fluorescence signal area for runx2 (B), sp7 (D), and oc1 (E) positive cells. Normality was tested though Anderson–Darling test (p < 0.05). For fluorescence signals, differences were tested through one-way ANOVA or Kruskal–Wallis test. Asterisks indicate p < 0.0021 (**), p < 0.0002 (***) and p < 0.0001 (****). For gene expression, differences were tested through a non-parametric Kruskal–Wallis test, followed by a Dunn’s multiple comparison test (significant P values are reported above each treatment)

Acknowledgments
This image is the copyrighted work of the attributed author or publisher, and ZFIN has permission only to display this image to its users. Additional permissions should be obtained from the applicable author or publisher of the image. Full text @ Cell. Mol. Life Sci.