FIGURE SUMMARY
Title

Role of microRNAs and their downstream target transcription factors in zebrafish thrombopoiesis

Authors
Al Qaryoute, A., Fallatah, W., Dhinoja, S., Raman, R., Jagadeeswaran, P.
Source
Full text @ Sci. Rep.

Knockdown screen of microRNAs and thrombocyte production. (
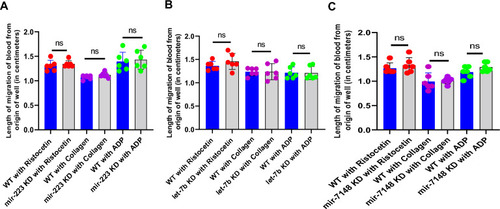
A) Knockdown screen of the fifteen-microRNAs and estimation of percentage of zebrafish thrombocytes in whole blood compared to daily wild-type (WT). (B) Confirmation of the results obtained from knockdown screen on the three microRNAs, mir-7148, let-7b, and mir-223 compared to daily WT injected with 1XPBS (WT). (C) Levels of mir-223, let-7b, and mir-7148 microRNA. Quantitative real-time PCR showing the fold change of mir-223, let-7b, and mir-7148 gene expression in liver and spleen after their knockdown (KD). The blue bars represent daily WT controls. All three knockdowns are shown as grey bars to the right of each WT daily controls. Error bars represent mean ± SD. Four replicate RNA samples pooled from six fish were used for each of mir-223, let-7b, and mir-7148 gene knockdowns, and control experiments (N = 4). The lines on the top of the bars represent a significant difference in fold change in gene expression between WT and knockdown samples. For (A) and (B), The blue bars represent daily WT controls injected with 1XPBS. Knockdowns of microRNAs are shown as grey bars to the right of each daily WT control. Six fish were used for each of the microRNA-knockdowns as well as control experiments (N = 6). The lines on the top of the bars represent a significant difference in the percentage of thrombocytes between WT and knockdown samples. For (A), (B) and (C) error bars represent mean ± SD. P value < 0.05 was considered significant. *** and **** represent p ≤ 0.001 and p ≤ 0.0001, respectively.

Effect of (A) mir-223, (B) let-7b, and (C) mir-7148 knockdowns in adult zebrafish on thrombocyte aggregation/agglutination. Zebrafish blood from the daily controls (WT, represented as blue bars) and the knockdown (KD, represented as grey bars) samples were subjected to whole blood aggregation/agglutination assay with ristocetin, collagen and ADP. The length of migration of blood from the origin of the well down the wall was measured and plotted. The results between WT and KD samples were compared. Six fish were used for each of the knockdown and control experiments (N = 6). The lines on the top of the bars represent a significant difference between WT and knockdown sample sets. Error bars represent mean ± SD. ns (non-significant) represents p>0.05.

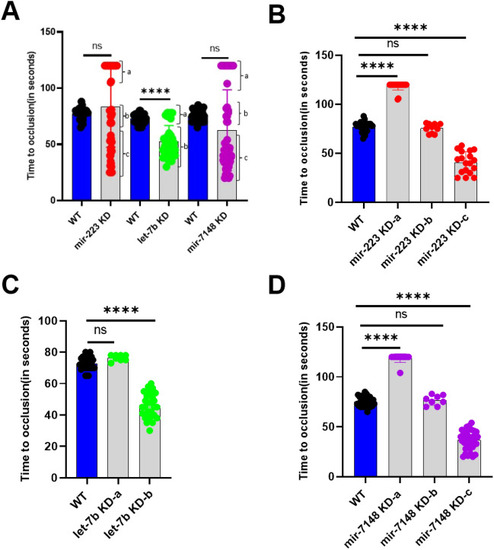
Arterial thrombosis in mir-223, let-7b, and mir-7148 knockdown larvae. (A) Comparison of time to occlusion of the caudal artery after laser injury between daily WT (blue bars) and knockdown (grey bars) 5 dpf larvae. Knockdown (KD) results of mir-223, let-7b, and mir-7148 are shown. The number of larvae used were 30 for daily control WT larvae and 52, 38, and 57 for mir-223, let-7b, and mir-7148 KD sets, respectively. Students’ t test was used for statistical analysis. Error bars represent mean ± SD. p value < 0.05 was considered significant. The lines on the top represent a significant difference between WT and knockdown samples. **** represents p ≤ 0.0001. The parentheses show groups a, b and c that show three distinct times to occlusion. (B), (C) and (D) represent comparison of times to occlusion for distinct groups a, b and c obtained from (A) for mir-223, let-7b, and mir-7148 knockdowns, respectively. In the one-way ANOVA analysis larval numbers obtained from (A) for WT were 30. For mir-223 knockdown 18, 10 and 24 larvae for groups a, b and c, respectively were included. For let-7b knockdown 8, and 30 larvae for groups a and b, respectively were chosen. For mir-7148 knockdown 35, 8 and 14 larvae for groups a, b and c, respectively were included.

Levels of the downstream transcription factor mRNAs after knockdowns of (A) let-7b and (B) mir-223. Quantitative real-time PCR showing the fold change of the transcriptional factor gene expression in daily wild-type (WT) controls (blue bars) and knockdown (KD) samples (grey bars). Four replicates containing six injected fish were used for each replicate sample and control experiments (N = 4). The lines on the top of the bars represent a significant difference between WT and knockdown samples. Error bars represent mean ± SD. *, **, ***, **** and ns (non-significant) represent p ≤ 0.05, p ≤ 0.01, p ≤ 0.001, p ≤ 0.0001, p >0.05 respectively.

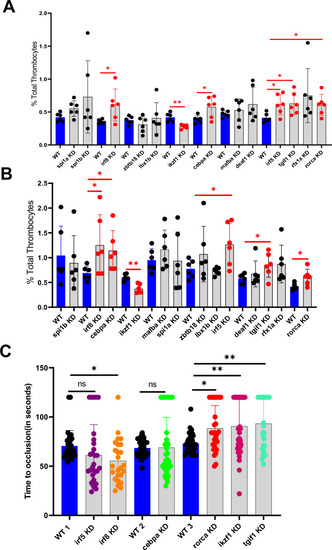
Flow cytometric analysis of total thrombocytes percentage in zebrafish whole blood. (A) Knockdown screen of the 13 transcription factors in adult zebrafish compared to daily wild-type (WT). (B) Confirmation of the results in (A). (A) and (B), compare the percentage of thrombocytes in whole blood from daily WT controls (blue bars), and knockdown (KD) samples (grey bars). Six fish were used for each of the transcriptional factors and control experiments (N = 6). The red lines on the top of the bars represent a significant difference between WT and knockdown sample sets. Error bars represent mean ± SD. * and ** represent p ≤ 0.05, and p ≤ 0.01 respectively. p value < 0.05 was considered significant. (C) Comparison of time to occlusion of the caudal artery after laser injury between 5 dpf daily WT control and knockdown (KD) larvae. The number of larvae used were 30, 29, 25, 40, 35, 31, 31, 42, and 27 in WT 1, irf5 KD, irf8 KD, WT 2, cebpa KD, WT 3, rorca KD, ikzf1 KD, and tgif1 KD sets, respectively. The lines on the top represent a significant difference between WT and knockdown samples. Error bars represent mean ± SD. *, **, ***, **** and ns (non-significant) represent p ≤ 0.05, p ≤ 0.01, p ≤ 0.001, p ≤ 0.0001, p >0.05 respectively.

Functional evaluation of ikzf1 mutant (A) Sequence analysis of ikzf1 mutant. The top and bottom sequence chromatograms represent WT ikzf1+/+ and heterozygote ikzf1+/−, respectively. The red boxes in the top and bottom chromatograms show the normal codon with a one peak for C and two peaks C and T, respectively (B) Comparison of time to occlusion of the caudal artery after laser injury between 5 dpf WT ikzf1+/+ larvae (blue bars) and a population containing both WT ikzf1+/+ and heterozygote ikzf1+/− larvae (grey bars). Forty larvae were used in each group experiments (N = 40). The lines on the top represent a significant difference between WT and mutant larvae. Error bars represent mean ± SD. **** represents p ≤ 0.0001.

Acknowledgments
This image is the copyrighted work of the attributed author or publisher, and ZFIN has permission only to display this image to its users. Additional permissions should be obtained from the applicable author or publisher of the image. Full text @ Sci. Rep.