IMAGE

Figure 1

ID
ZDB-IMAGE-231002-113
Source
Figures for Al Qaryoute et al., 2023
Image
Figure Caption

Figure 1

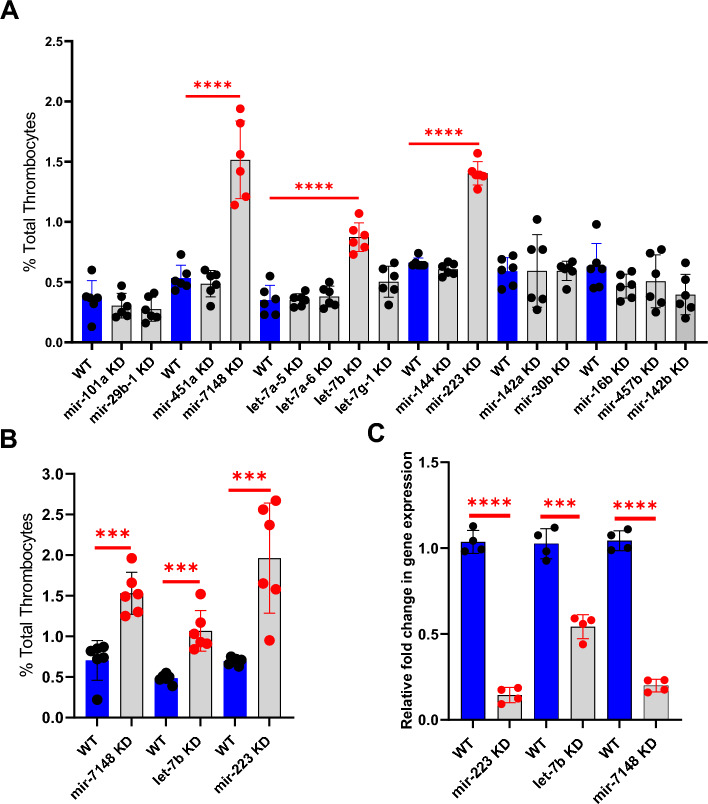
Knockdown screen of microRNAs and thrombocyte production. (A) Knockdown screen of the fifteen-microRNAs and estimation of percentage of zebrafish thrombocytes in whole blood compared to daily wild-type (WT). (B) Confirmation of the results obtained from knockdown screen on the three microRNAs, mir-7148, let-7b, and mir-223 compared to daily WT injected with 1XPBS (WT). (C) Levels of mir-223, let-7b, and mir-7148 microRNA. Quantitative real-time PCR showing the fold change of mir-223, let-7b, and mir-7148 gene expression in liver and spleen after their knockdown (KD). The blue bars represent daily WT controls. All three knockdowns are shown as grey bars to the right of each WT daily controls. Error bars represent mean ± SD. Four replicate RNA samples pooled from six fish were used for each of mir-223, let-7b, and mir-7148 gene knockdowns, and control experiments (N = 4). The lines on the top of the bars represent a significant difference in fold change in gene expression between WT and knockdown samples. For (A) and (B), The blue bars represent daily WT controls injected with 1XPBS. Knockdowns of microRNAs are shown as grey bars to the right of each daily WT control. Six fish were used for each of the microRNA-knockdowns as well as control experiments (N = 6). The lines on the top of the bars represent a significant difference in the percentage of thrombocytes between WT and knockdown samples. For (A), (B) and (C) error bars represent mean ± SD. P value < 0.05 was considered significant. *** and **** represent p ≤ 0.001 and p ≤ 0.0001, respectively.

Acknowledgments
This image is the copyrighted work of the attributed author or publisher, and ZFIN has permission only to display this image to its users. Additional permissions should be obtained from the applicable author or publisher of the image. Full text @ Sci. Rep.