IMAGE

Figure 4

ID
ZDB-IMAGE-231002-117
Source
Figures for Al Qaryoute et al., 2023
Image
Figure Caption

Figure 4

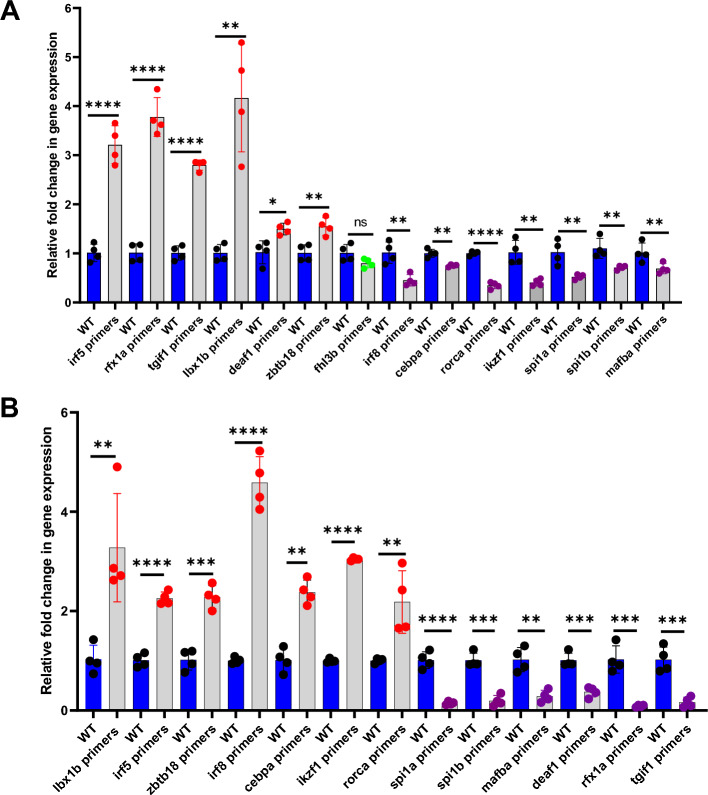
Levels of the downstream transcription factor mRNAs after knockdowns of (A) let-7b and (B) mir-223. Quantitative real-time PCR showing the fold change of the transcriptional factor gene expression in daily wild-type (WT) controls (blue bars) and knockdown (KD) samples (grey bars). Four replicates containing six injected fish were used for each replicate sample and control experiments (N = 4). The lines on the top of the bars represent a significant difference between WT and knockdown samples. Error bars represent mean ± SD. *, **, ***, **** and ns (non-significant) represent p ≤ 0.05, p ≤ 0.01, p ≤ 0.001, p ≤ 0.0001, p >0.05 respectively.

Acknowledgments
This image is the copyrighted work of the attributed author or publisher, and ZFIN has permission only to display this image to its users. Additional permissions should be obtained from the applicable author or publisher of the image. Full text @ Sci. Rep.