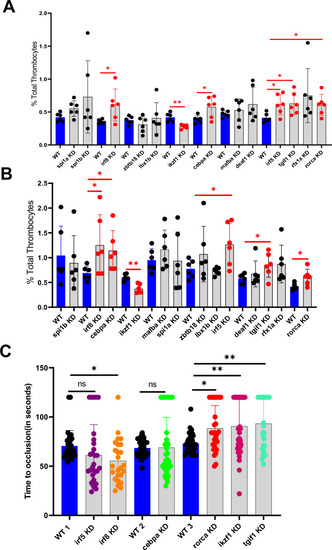
Flow cytometric analysis of total thrombocytes percentage in zebrafish whole blood. (A) Knockdown screen of the 13 transcription factors in adult zebrafish compared to daily wild-type (WT). (B) Confirmation of the results in (A). (A) and (B), compare the percentage of thrombocytes in whole blood from daily WT controls (blue bars), and knockdown (KD) samples (grey bars). Six fish were used for each of the transcriptional factors and control experiments (N = 6). The red lines on the top of the bars represent a significant difference between WT and knockdown sample sets. Error bars represent mean ± SD. * and ** represent p ≤ 0.05, and p ≤ 0.01 respectively. p value < 0.05 was considered significant. (C) Comparison of time to occlusion of the caudal artery after laser injury between 5 dpf daily WT control and knockdown (KD) larvae. The number of larvae used were 30, 29, 25, 40, 35, 31, 31, 42, and 27 in WT 1, irf5 KD, irf8 KD, WT 2, cebpa KD, WT 3, rorca KD, ikzf1 KD, and tgif1 KD sets, respectively. The lines on the top represent a significant difference between WT and knockdown samples. Error bars represent mean ± SD. *, **, ***, **** and ns (non-significant) represent p ≤ 0.05, p ≤ 0.01, p ≤ 0.001, p ≤ 0.0001, p >0.05 respectively.
|
