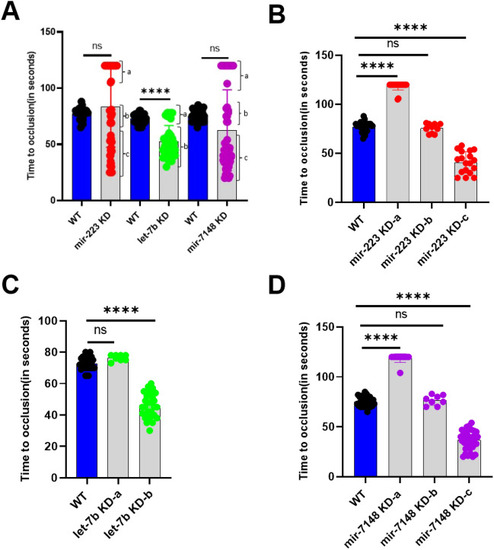
Arterial thrombosis in mir-223, let-7b, and mir-7148 knockdown larvae. (A) Comparison of time to occlusion of the caudal artery after laser injury between daily WT (blue bars) and knockdown (grey bars) 5 dpf larvae. Knockdown (KD) results of mir-223, let-7b, and mir-7148 are shown. The number of larvae used were 30 for daily control WT larvae and 52, 38, and 57 for mir-223, let-7b, and mir-7148 KD sets, respectively. Students’ t test was used for statistical analysis. Error bars represent mean ± SD. p value < 0.05 was considered significant. The lines on the top represent a significant difference between WT and knockdown samples. **** represents p ≤ 0.0001. The parentheses show groups a, b and c that show three distinct times to occlusion. (B), (C) and (D) represent comparison of times to occlusion for distinct groups a, b and c obtained from (A) for mir-223, let-7b, and mir-7148 knockdowns, respectively. In the one-way ANOVA analysis larval numbers obtained from (A) for WT were 30. For mir-223 knockdown 18, 10 and 24 larvae for groups a, b and c, respectively were included. For let-7b knockdown 8, and 30 larvae for groups a and b, respectively were chosen. For mir-7148 knockdown 35, 8 and 14 larvae for groups a, b and c, respectively were included.
|
