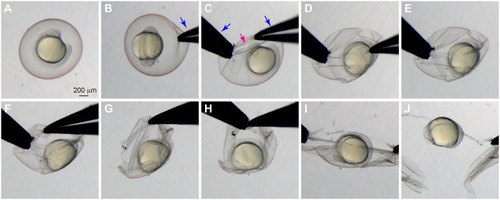
Manual dechorionation of live zebrafish embryos. Bright-field images illustrating the dechorionation process. (A) A live embryo before dechorionation. (B) A pair of forceps is used to gently pinch the chorion. (C) A second pair of forceps is used to pinch the chorion near the first pinch and to gently pull it apart. (D) The hole is made bigger, but not so much that the chorion collapses inward and squeezes the embryo. (E,F) Forceps are repositioned as needed to avoid squeezing the embryo. (G,H) Repositioning multiple times may be necessary. (I) Once the hole is large enough, the chorion is pulled apart without it collapsing inward and squeezing the embryo. (J) The embryo after dechorionation. Magenta arrow, hole in the chorion; blue arrows, forceps.
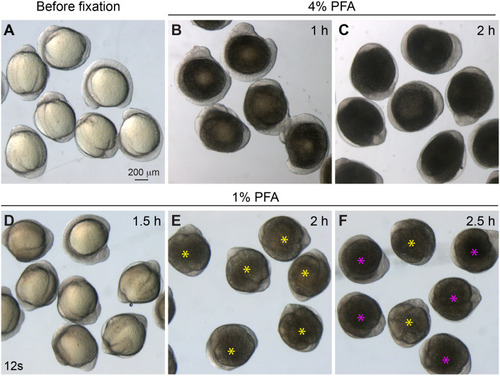
Embryo fixation under different conditions. Bright-field images of embryos at 12 somites. (A) Live embryos before fixation. (B-C) Embryos fixed with 4% PFA for 1 h (B), and 2 h (C), both over-fixed. (D-F) Embryos fixed with 1% PFA for 1.5 h (D, under-fixed), 2 h (E, optimally fixed, yellow asterisks) and 2.5 h (F, some are over-fixed, magenta asterisks; some are optimally fixed, yellow asterisks).
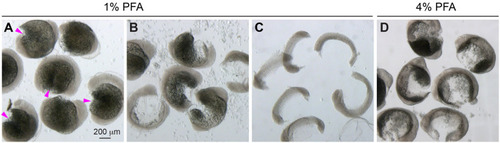
Manual deyolking of embryos. Bright-field images of manually deyolked embryos. (A) Embryos with pierced yolk sacs (magenta arrowheads). (B) Embryos with partially or almost-completely removed yolk cells. (C) Embryos with completely removed yolks. (D) Embryos fixed in 4% PFA still retained many yolk cells after aggressive and persistent pipetting.
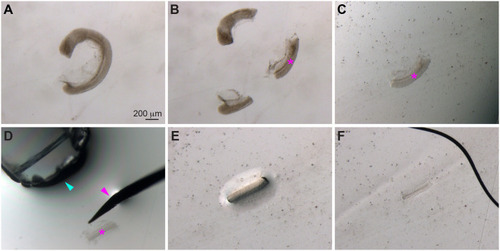
Deyolked embryonic tissue mounted on bridged slides. Bright-field images showing deyolked embryonic tissue mounted on a bridged coverslip. (A) A deyolked embryo. (B) An embryo was trimmed to obtain the desired tissue (magenta asterisk, used for imaging the gut endoderm). (C) The desired tissue was transferred in PBST to a 24×60 mm bridged coverslip. (D) PBST was removed by a glass pipette (cyan arrowhead), while the tissue was stabilized with a metal probe (magenta arrowhead). (E) The tissue after removal of PBST. (F) The tissue was mounted between the bridged coverslip and a 24×24 mm coverslip, and mounting medium was added, submerging the sample from the bottom left to the top right.
Deyolked embryonic tissue mounted on bridged slides. Images showing the series of steps for embryo mounting. Descriptions of each step are provided in the right panels.
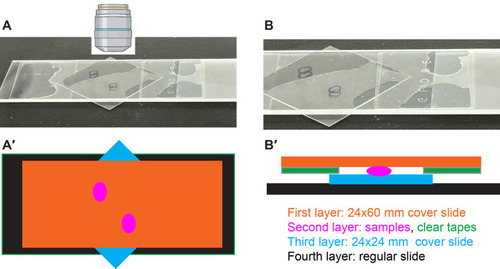
Samples are placed on a bridged slide for imaging. (A) Image showing the final slide with samples mounted between the 24×60 mm and 24×24 mm coverslips, supported by a regular slide. (B) Zoomed-in image of A. (A′-B′) Schematic showing the construction of a bridged slide (A′, top view; B′, side view), which consists of multiple layers: the first layer (orange) is a 24×60 mm coverslip, the second layer is made of clear tape (green) and samples (magenta); the third layer is a 24×24 mm coverslip (blue); and the fourth layer is a regular slide (black).
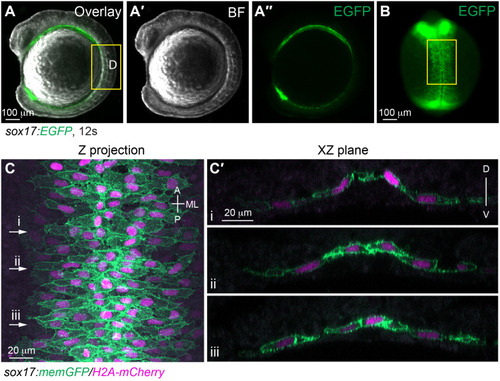
The morphology of gut endoderm at 12 s. (A-B) Images of a live embryo in which the endoderm is labeled with EGFP. (A-A″) Lateral view. (A) Overlay image of brightfield (A′) and epifluorescence image of EGFP (A″). (B) Dorsal view. Epifluorescence image of EGFP. (C-C′) Confocal images taken from a flat-mounted sample at a similar region outline in B (highlighted by yellow rectangles), showing endodermal cells labelled with the plasma membrane (GFP) and nuclei (pseudo-colored magenta). (C) Z projection of XY view. (C′) Images of XZ planes taken at the positions marked by i-iii in C. A, anterior; P, posterior; ML, mediolateral; D, dorsal; V, ventral.
The morphology of gut endoderm in 48 hpf embryos. (A-B) Images of a live embryo in which the endoderm is labeled with EGFP. (A) Overlay image of brightfield and epifluorescence of EGFP, Lateral view. (B) Epifluorescence EGFP image. Dorsal view. (C-G′) Confocal images taken from a flat-mounted sample at a similar region outline in B (highlighted by yellow rectangle), showing the expression of actin (detected by Phalloidin staining) in memGFP-labelled gut endoderm. Yellow arrowheads, actin-enriched gut lumen. (C-D′) Images of XY view. (C) Z projection image. (D-D′) Single plane images. (E-G′) Images of XZ planes taken at the positions marked by i-iii in D. White arrowheads, actin enriched sites. A, anterior; P, posterior; V, ventral; D, dorsal; ML; mediolateral.
Acknowledgments
This image is the copyrighted work of the attributed author or publisher, and
ZFIN has permission only to display this image to its users.
Additional permissions should be obtained from the applicable author or publisher of the image.
Full text @ Biol. Open
Your Input Welcome
Thank you for submitting comments. Your input has been emailed to ZFIN curators who may contact you if
additional information is required.
Oops. Something went wrong. Please try again later.