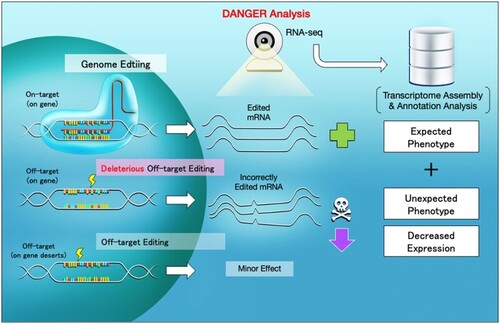
Scheme of CRISPR-Cas9 targeting, deleterious off-target editing, and DANGER analysis.

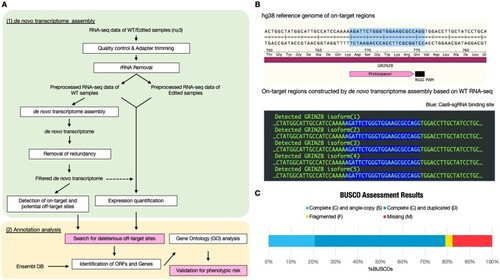
Overview of DANGER analysis and on-target region constructed by de novo transcriptome assembly. (A) Bioinformatic workflow of DANGER analysis. Our analysis requires RNA-seq data derived from WT and edited (each n ≥ 3). DANGER analysis has two steps in the workflow: (i) de novo transcriptome assembly (upper background box) and (ii) annotation analysis (lower background box). The de novo transcriptome assembly step is processed with Trinity and preprocessing tools, such as cutadapt and bbduk.sh. Crisflash performs the search of on/off-target sequences. The RSEM quantifies gene expression in edited RNA-seq samples in comparison to the WT de novo transcriptome (dot allow). The step of annotation analysis was involved processing with TransDedoder, ggsearch, org. XX.eg.db (e.g. org. Hs.eg.db in the transcriptome related to humans), and topGO. We implemented specific modules, colored in pink, for considering the phenotypic effect of deleterious off-targets. (B) Comparison between the hg38 reference genome and transcript sequence constructed by de novo assembly of RNA-seq samples derived from WT iPSC-derived cortical neurons on the GRIN2B on-target region. The on-target region of the hg38 reference genome is illustrated with annotations of the GRIN2B CDS, the protospacer, and the NGG PAM sequence of SpCas9. The detected GRIN2B isoforms (1–5) are lined up in the box. The Cas9–sgRNA binding sites are highlighted. (C) Genome completeness of de novo transcriptome assembly RNA-seq data derived from WT iPSC-derived cortical neurons was assessed using conserved mammal BUSCO genes (mammalia_odb10). The result was 79.1% of “complete,” 20.7% of “single-copy,” 58.4% of “duplicated,” 3.2% of “fragmented,” and 17.7% of “missing” (n = 9226).

The benchmark for expression analysis methods compared with reference-based RNA-seq analysis using RNA-seq data derived from WT and GRIN2B edited iPSC-derived cortical neurons. (A) Comparison of different expression analyses. A Venn diagram comparing the de novo transcripts (duplicate counts on a predicted ORF basis), which had potential off-target sites with up to 8 nt MMs, was detected by the dTPM and dDE approaches. dTPM indicates that the expression is decreased based on the ratio of TPM counts between WT and edited samples (left callout). dDE means the expression is reduced based on DEG analysis between WT and edited samples (right callout). (B) Comparison of de novo transcriptome assembly- and reference-based analysis on the deleterious off-target detection. A Venn diagram comparing the off-target genes identified from de novo transcriptome analysis [dTPM (t = 0.4) and dDE (α = 0.001) approaches] and reference-based RNA-seq analysis (CRISPRroots, “RISK: CRITICAL”). (C) Genomic sequence map of off-target located outside of GALR2 mRNA. The sequence is a part of the hg38 reference genome with annotations of GALR2 mRNA (XM_047436984.1) and the de novo transcript (TRINITY_DN86617_c0_g1_i1) and an off-target site with three MMs compared to the on-target sequence. (D) Summary of deleterious off-target sites detected by dTPM and reference-based RNA-seq analysis (CRISPRroots, “RISK: CRITICAL”). The counts of off-target sites are annotated with genes and classified by MM number related to the on-target sequence. The brackets indicate the number of transcripts, including those with and without identified gene annotations.

The result of risk assessment in DANGER analysis using RNA-seq data derived from WT and GRIN2B edited iPSC-derived cortical neurons. (A) An example of the annotation table for DANGER analysis. The table includes GO ID, GO term, number of MMs (n), and the counts of n-MM off-target genes belonging to a specific GO term. (B) The formula for phenotypic off-target risk (D-index). An example of the calculation is shown on a lower box. (C) Distribution of the D-index of each GO term. The sum of all D-indexes and the number of D-indices (N) were labeled on the top right.

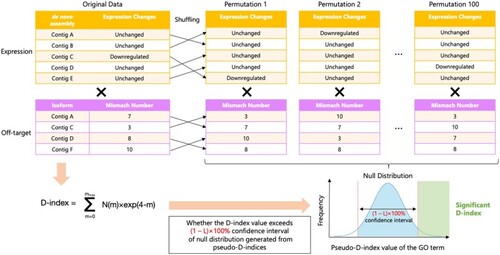
A scheme for permutation testing to evaluate the validity of the D-index. The thin arrow indicates the manipulation of rearranging values from the original expression and off-target profile to the permutation data. The cross represents the computation for applying the D-index formula to the above expression profile and the below off-target profile data. The workflow is shown as the bold arrows.

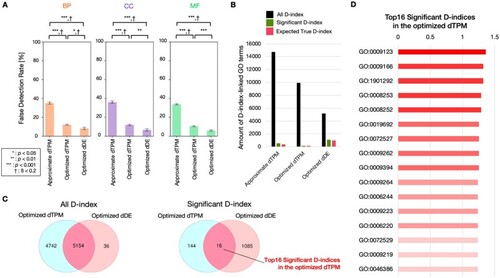
Evaluation of permutation test for DANGER analysis and comparison between dTPM and dDE. (A) Comparison of false detection rates among approximate dTPM (up to 11-MM NRR PAM, t = 0.4, L = 5E-1), optimized dTPM (up to 8-MM NGG PAM, t = 0.4, L = 1E-15), and optimized dDE (up to 8-MM NGG PAM, α = 0.001, L = 1E-15) in GO categories. BP, CC, and MF indicate GO categories of Biological Process, Cellular Component, and Molecular Function, respectively. Error bars represent SEM; asterisk indicates the statistical significance of two-sided Welch’s t-test; cross indicates statistical power (1-ß)>0.8. Mean±SD of n = 10 permutation data set. (B) Comparison of amount of GO terms of all D-index, significant D-index, and expected true D-index among approximate dTPM (up to 11-MM NRR PAM, t = 0.4, L = 5E-1), optimized dTPM (up to 8-MM NGG PAM, t = 0.4, L = 1E-15), and optimized dDE (up to 8-MM NGG PAM, α = 0.001, L = 1E-15), respectively. (C) Comparison of D-index and significant D-index between optimized dTPM and optimized dDE. A Venn diagram comparing the counts of D-index and significant D-index between optimized dTPM and optimized dDE. (D) The list of the top 16 significant D-indices in the optimized dTPM. The D-index values are indicated by bar graphs adjacent to the GO terms.

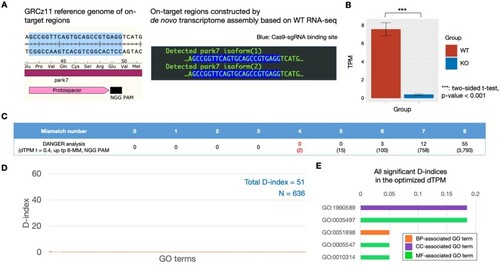
DANGER analysis result using RNA-seq data derived from WT and park7 (dj1) edited brains of Danio rerio. (A) Comparison between the GRCz11 reference genome and transcript sequence constructed by de novo assembly of RNA-seq samples derived from WT brain on park7 on-target region. The on-target region of the GRCz11 reference genome is illustrated with annotations of the park7 CDS, the protospacer, and the NGG PAM sequence of SpCas9. The detected park7 isoforms (1–2) are lined up in the box. The Cas9–sgRNA binding sites are highlighted. (B) Comparison of TPM values of park7. The TPM was measured from WT and edited RNA-seq samples (each n = 3); data were expressed as the means±SEM. ***P-value <.001 of two-sided Welch’s t-test. (C) The gene counts are classified by MM number related to the on-target sequence. The brackets indicate the number of transcripts, including those with and without identified gene annotations. (D) Distribution of the D-index of each GO term associated with Biological Process. The sum of all D-indices and the number of D-indices (N) is labeled on the top right. (E) The list of all significant D-indices in the optimized dTPM. The D-index values are indicated by bar graphs adjacent to the GO terms.

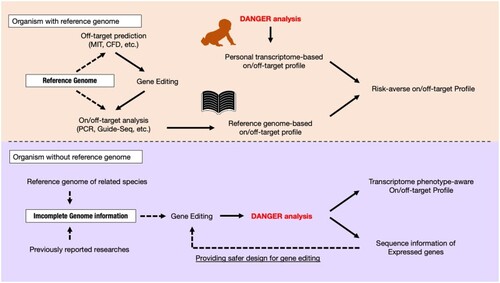
Our proposal for the usage of DANGER analysis in organisms with and without a reference genome. The workflow is shown as black arrows. The dotted black arrows indicate the front of the arrow and refer to the arrow base information. The image of the book is from TogoTV (© 2016 DBCLS TogoTV, CC-BY-4.0, https://creativecommons.org/licenses/by/4.0/).

Acknowledgments
This image is the copyrighted work of the attributed author or publisher, and ZFIN has permission only to display this image to its users. Additional permissions should be obtained from the applicable author or publisher of the image. Full text @ Bioinform Adv