
Image
|
Figure Caption
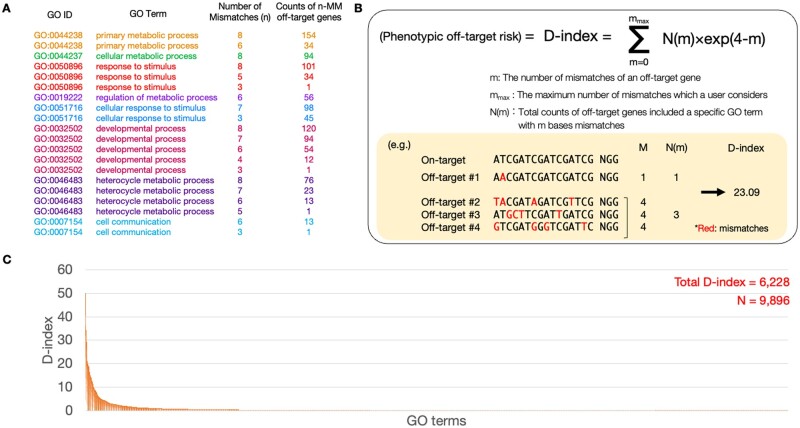
Figure 4.
The result of risk assessment in DANGER analysis using RNA-seq data derived from WT and GRIN2B edited iPSC-derived cortical neurons. (A) An example of the annotation table for DANGER analysis. The table includes GO ID, GO term, number of MMs (
Acknowledgments
This image is the copyrighted work of the attributed author or publisher, and
ZFIN has permission only to display this image to its users.
Additional permissions should be obtained from the applicable author or publisher of the image.
Full text @ Bioinform Adv